The U.S. new-vehicle market began February with a noticeable easing in buyer momentum while inventory levels remained largely unchanged. The latest data, according to Cox Automotive’s vAuto Live Market View, shows the 30-day sales pace at 845,216 units, down 22% month over month and down 4% from January 2025. Demand softened meaningfully in January, though seasonally consistent, even as inventory held steady near 2.77 million units. With throughput slowing notably and supply holding steady, days’ supply naturally rises, jumping to 98 in January, signaling longer turn times on dealer lots.
2.77M
Total Inventory
as of Jan. 30, 2026
98
Days’ Supply
$49,248
Average Listing Price
Compared with the December report, when the 30-day sales pace was just above 1 million units and the national days’ supply sat at 76, conditions have shifted. Severe winter storms across the country likely played a role in slowing showroom traffic. Dealers are carrying roughly the same number of vehicles, but shoppers are moving more slowly, stretching turn rates and prompting modest price adjustments. February opened with average listing prices slightly lower at $49,248, down 2.6% from a month earlier but up 1.4% from the same time last year, which is evidence of selective, measured responses from dealers rather than broad discounting.
Zooming out to a year-over-year view, the picture does improve. The sales pace is down only 4.0% year over year, while inventory volume and days’ supply are both lower than at this point one year ago. This combination suggests the industry is structurally healthier than during last winter’s elevated stock environment, even as the current month shows clear signs of short-term slowing.
Automakers Maintain Steady Inventory as Sales Slow
Across mainstream brands, the pattern is consistent and distinct: Inventory counts are relatively stable, but slower sales are driving higher days’ supply.
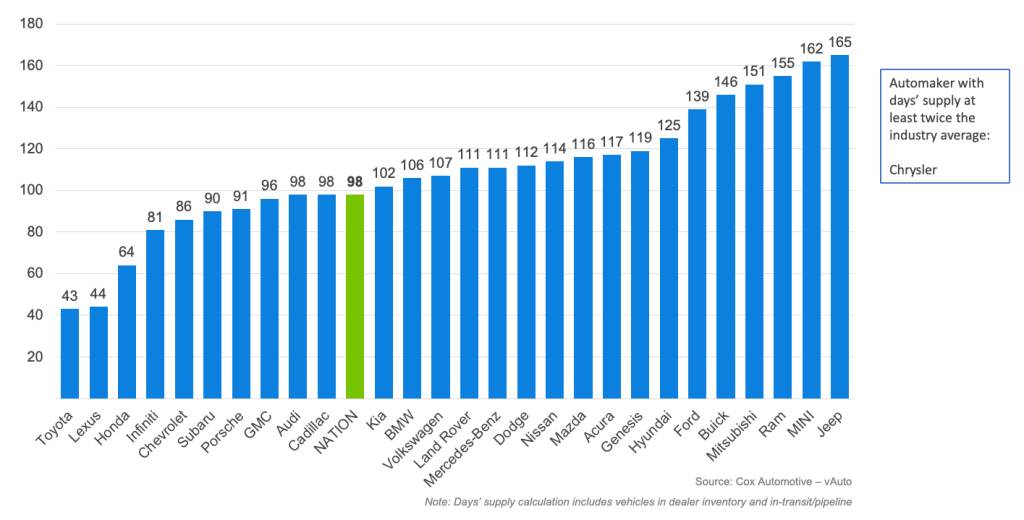
Toyota continues to operate with a comparatively lean footprint. Its sales pace in January fell by roughly 25% compared to December, pushing days’ supply from the low-30s into the low-40s. Even with this softening, Toyota remains one of the most balanced operators in the market.
Nissan sales pace in January slowed by 12% from the prior month, lifting days’ supply from the mid-90s to above 110. Honda’s cadence cooled similarly, with sales falling 17% and with days’ supply rising from the upper-40s into the mid-60s. Hyundai and Kia posted sales declines of 23% to 11%, respectively, pushing their days’ supply well into triple digits for Hyundai and into the low 100s for Kia.
Among the largest domestic full-line manufacturers, pressure is more pronounced. Chevrolet’s sales slowed by about 25% month over month, pushing days’ supply from the upper-60s into the mid-80s. Ford’s sales pace declined even more sharply, dropping 30%, with days’ supply jumping from the mid-90s to well above 130.
Taken together, all these shifts underscore that the market’s higher days’ supply reflects a slower sales pace, not rising inventory. Across brands, inventory counts are either flat or moving only modestly. The key story: January was just a slow month, and dealers echoed this reality at NADA 2026, noting quiet showrooms even for those with well-balanced stock positions.
January Days’ Supply of Inventory by Brand
Major Vehicle Models See Sales Slowdown Across the Board
At the model level, core nameplates mirror their parent brands. High-volume models such as the Toyota Camry, Corolla, Highlander; the Honda Accord and CR-V; the Nissan Altima and Ford’s F-Series all showed sales pace declines of roughly 20% to 30%. Days’ supply for these models increased by 15 to 40 days, depending on the vehicle.
The F-Series, one of the industry’s highest-volume nameplates, now sits deep into triple-digit days’ supply after spending much of the winter in the mid-90-day range, though pickup trucks generally always carry larger inventory given consistent high demand and trim-level complexity. Midsize sedans and SUVs like the Honda Accord and the Toyota Highlander follow similar trajectories, moving from sub-60-day turn levels toward the 80-day range.
While some lower-volume outliers exist, the broader pattern is clear: Softening demand layered on stable supply is extending turn times across most major brands.
Modest Price Decline Points to Disciplined Dealer Response
The average listing price of $49,248 is slightly lower than at the beginning of the year. The decline is modest, less than 3%, and reflects a combination of subtle mix shifts and selective price positioning by retailers. The move is not large enough to indicate meaningful discount pressure, but it does highlight that dealers are reacting appropriately to the pace of demand.
Deceleration Without Deterioration
The latest data indicate deceleration, not deterioration. Inventory levels remain healthy, below last year’s 3 million-plus peak, yet buyer flow has softened meaningfully, lengthening time on the lot. Brands with disciplined inventory management, including Toyota and Honda and their associated premium lines, continue to demonstrate resilience, maintaining cleaner lots and retaining pricing authority even as the national cadence eases. Meanwhile, volume manufacturers with higher inventory relative to turn, particularly in the domestic full-line segment, face greater pressure to accelerate sales through targeted incentives or price adjustments if demand does not re-energize naturally in the months ahead.
On a year-over-year basis, the market remains fundamentally stronger. Implied demand is higher, inventory is leaner, turn rates are more efficient, and the current slowdown fits squarely within seasonal expectations and can be explained in part by foul winter weather in much of the country. Given the projected increase in tax refunds and forecasts for a general, late-February warm-up for much of the country, the anticipated “spring bounce” should provide meaningful support over the coming months.