In November, the electric vehicle (EV) market’s downturn deepened, with the expiration of the federal tax credit continuing to weigh on demand. Market share reached multi-year lows as sales declined. Weak demand fueled a surge in inventory, with days’ supply reaching elevated levels. Pricing eased across the market, underscoring an industry struggling to find balance in the post-incentive era.
New and Used EV Sales – November
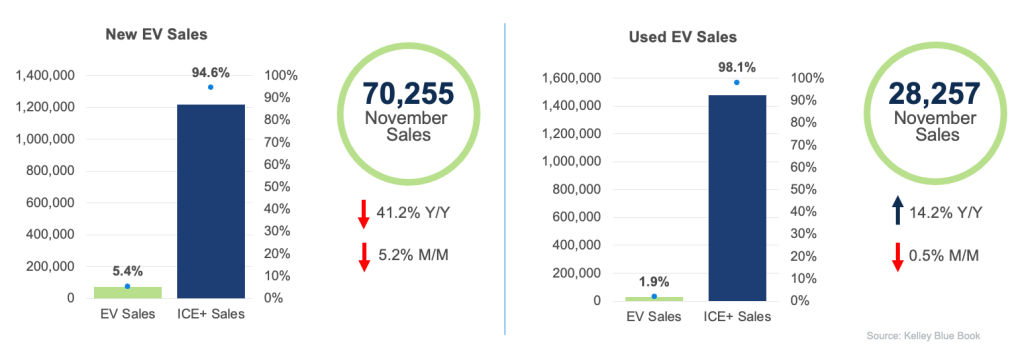
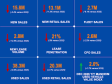
New EV Sales: Estimated November new EV sales totaled 70,255 units, down 41.2% from a year earlier and declining 5.2% from October. Despite November’s weakness, year-to-date EV sales remain 2.1% above last year’s pace. EV share of total sales fell to 5.4% in November, the lowest since April 2022 and down from October’s 5.8%. By volume, the market leaders were Tesla (39,800), Rivian (4,500), Ford (4,188), Chevrolet (3,112), and Hyundai (2,853). Tesla dropped 2.1% month over month but gained 2.2 percentage points of market share to reach 56.7%, as competitors faced even steeper declines. Several brands posted year-over-year sales volume gains, with Rivian leading at 7.6% and showing the strongest momentum. Rivian’s sales volume was up 14.1% from October.
Used EV Sales: In November, used EV sales reached 28,257 units, up 14.2% year over year but down 0.5% from October. Used EV market share held steady at 1.9%. Tesla led the segment with 10,785 units sold, followed by Ford with 2,094, Audi with 1,848, Chevrolet with 1,790, and BMW with 1,596. Tesla’s dominance extends to the model level, claiming four of the top five spots. Among the top five brands, Audi posted the strongest month-over-month performance with a 12.1% gain.
New and Used EV Days’ Supply – November
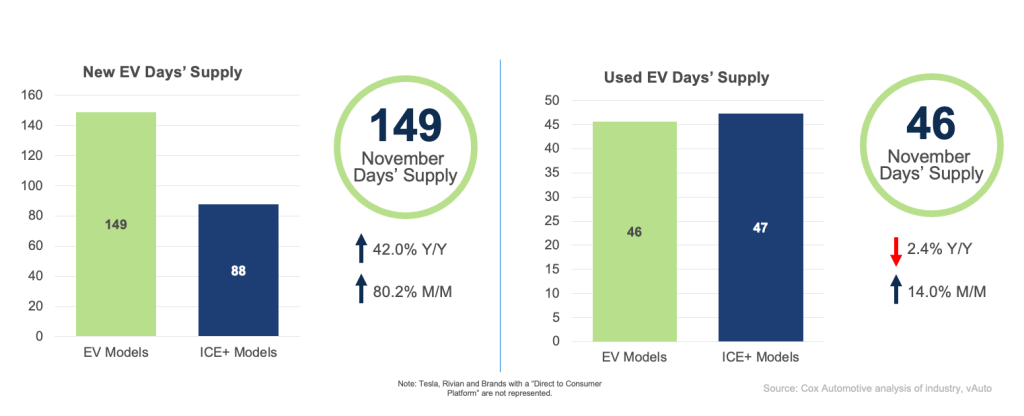
EV Days’ Supply: In November, new EV days’ supply soared to 149 days – up 42.0% year over year and 80.2% month over month – marking the highest inventory level since February 2024. This inventory level represents a dramatic reversal from September’s near-record low of 46 days. Toyota, Volkswagen and Hyundai were brands with the highest days’ supply in the latest measure, while BMW had the leanest inventory.
Used EV Days’ Supply: In November, used EV days’ supply was 46 days, down 2.4% year over year but up 14% from October, remaining below ICE+ levels for the eighth consecutive month. Supply varied widely by brand, ranging from Tesla’s tightest inventory at 37 days to Volkswagen’s 56 days among major brands. Note: Tesla figures reflect only vehicles available through traditional dealerships, excluding direct-to-consumer models.
New and Used EV Prices – November
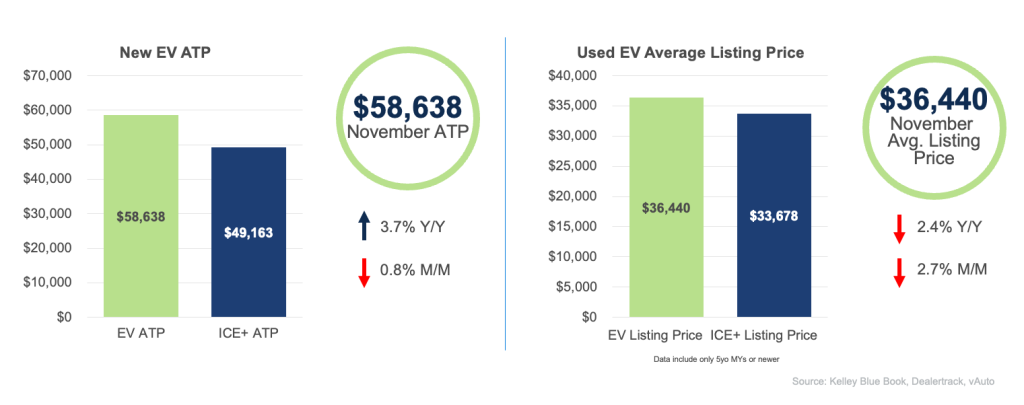
New EV ATP: In November, the average transaction price (ATP) for new electric vehicles was $58,638, up 3.7% year over year but down 0.8% from October. Incentives rebounded to $7,785, or 13.3% of ATP, up from October’s year-low of 11.1%, while the price premium over ICE+ vehicles narrowed to $9,475. Tesla’s ATP rose 1.5% month over month to $54,310, but with its dominant market share and below-market pricing, it continued to push the overall segment average downward.
Used EV Listing Price: In November, the average listing price for used EVs fell 2.4% year over year and 2.7% month over month to $36,440, narrowing the price premium over ICE+ vehicles to $2,762. Most brands posted month-over-month declines, with only Volvo, up 3.5%, and Kia, up 2.7%, showing notable increases. The average listing prices for a used Tesla slipped 1.8% to $31,515, a modest drop that heavily influenced the segment average given its dominant share. Forty-three models remained under $30,000, including the Tesla Model 3 at $23,583, the highest-volume used EV on the market.
Looking Ahead
As we head into 2026, the EV market will continue navigating post-incentive challenges, with inventory and pricing dynamics shaping near-term performance. Sustained recovery will depend on aligning production with demand, strategically leveraging incentives, and rebuilding consumer confidence to support long-term growth.
The EV Market Monitor gauges the health of the new and used electric vehicle (EV) markets by monitoring sales volume, days’ supply and average pricing. Each metric will be measured month over month and year over year. For the latest detailed new-EV sales report, see the Q3 Electric Vehicle Report, the official quarterly report of EV data.