This edition of the Auto Market Weekly Summary includes updates on new-vehicle sales and pricing, inflation, consumer credit, personal income and spending, and Gross Domestic Product (GDP). March data arrived with a split personality for the auto industry, with a healthy spring selling season colliding with the energy shock from the Middle East conflict and headline inflation rising dramatically in March.
Bottom Line Up Front
March was a mixed bag for the auto industry, with some important cautions building in the background. New-vehicle sales rose meaningfully and wholesale values continued to reflect the Spring Bounce. Tax refund dollars flowed well in March and continue to do so, with the average refund running nearly 11% ahead of last year and providing near-term support for consumer purchasing power.
The inflation situation, however, shifted notably last month. The energy shock from the Middle East conflict was loud and clear in headline Consumer Price Index (CPI) data and pushed the monthly increase to 0.9%—the largest single-month gain since June 2022—driven almost entirely by rising gasoline prices.
Income and spending data offer a reminder that consumers were already navigating a more difficult environment before the energy shock arrived. Real disposable income growth has slowed to the lowest level in roughly a year, consumer spending gains have been modest for several months running, and the personal saving rate is drifting lower.
The Spring Bounce continues, but the macro backdrop is becoming more challenging. Affordability pressures were present before gasoline prices moved higher, and the financing cost environment shows little sign of easing. The next several weeks will be an important test of how much the seasonal tailwind can offset the headwinds building for the consumer.
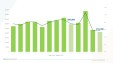
New-Vehicle Sales and Pricing
March new-vehicle sales increased versus February but dropped against the prior year as affordability challenges persisted. Manufacturers held pricing discipline despite the volume push, deploying somewhat higher incentives to drive traffic while keeping transaction prices essentially flat month over month.
- March 2026 sales totaled 1,407,174 units, up 17.8% month over month as seasonal demand accelerated. Sales declined 11.6% versus March 2025.
- Average transaction prices (ATPs) were $49,275, down just 0.1% month over month from February, but higher by 3.5% year over year. March was the fourth consecutive month of accelerating year-over-year gains.
- Average incentives rose 5.5% against last year. Incentives as a percentage of ATP increased to 7.2%, up from February’s 6.9% and slightly above last year’s 7.1%.
Inflation Reads
The Fed’s preferred inflation measure, the Personal Consumption Expenditures (PCE) Price Index, came in as expected in February, holding steady on a year-over-year basis, while the March CPI confirmed that the energy shock from the Middle East conflict is now forcefully impacting headline inflation.
- The PCE deflator rose 0.4% in February, leaving the year-over-year rate unchanged at 2.8%. This reading was above the Fed’s 2% target, but stable relative to January.
- Core PCE also rose 0.4% in February; the year-over-year rate fell slightly from 3.1% in January to 3.0% in February.
- Goods prices were the primary source of upward pressure, with the durable goods PCE deflator rising 1.1% for the month. Energy goods prices rose 1.4% in February, a sign of building momentum ahead of the Middle East conflict.
- Headline CPI surged 0.9% in March—the largest monthly increase since June 2022 and driven almost entirely by a 21.2% jump in gasoline prices. The year-over-year rate rose to 3.3% from 2.4% in February.
- Core CPI (excluding food and energy) rose 0.2% in March, leaving the year-over-year rate essentially stable at 2.6%.
Consumer Credit
Last week, the Federal Reserve updated its report on Consumer Credit through February, with credit growth of $9.5 billion coming in below expectations. The report showed gains were led by non-revolving loans, with more muted growth in revolving credit. The overall annualized rate of growth increased from January levels.
- Total consumer credit rose by 0.2% in the month of February, reflecting an annualized growth rate of 2.2%, above January’s 1.8% pace.
- Non-revolving credit increased 0.2% in the month and at an annual rate of 2.8%, the fastest pace of growth seen since September 2025.
- Revolving credit growth slowed markedly, rising by just 0.1% in the month. The annual growth rate in February was just 0.6%, down from the 2.3% pace in January.
- The lower level of revolving credit growth could be partially driven by higher levels of tax refunds, allowing consumers to pay down balances on credit cards and refrain from taking on additional revolving credit in the month.
Personal Income and Spending
February income and spending data present a cautionary picture heading into Q2, with real purchasing power eroding and consumer spending already fading before the energy shock now working through the economy.
- Nominal personal income fell 0.1% in February, reversing a 0.4% gain in January, driven by lower dividend income and a drop in government transfer receipts.
- Real disposable income fell 0.5% in February and is now up just 1.1% year over year. Elevated tax refunds are expected to provide a modest boost to disposable income in the coming months.
- Real consumer spending rose just 0.1% in February, continuing a streak of subdued gains (0.0% in January, 0.1% in both November and December).
- Motor vehicle spending pushed durable goods higher.
- Nondurable goods spending fell for the third consecutive month, while services spending growth was weak.
- The personal saving rate slipped to 4% in February from 4.5% in January, below historical norms.
Gross Domestic Product
The third and final estimate of Q4 2025 GDP confirmed a sharp deceleration in economic growth to close the year, with the government shutdown acting as a significant drag on an otherwise consumer-driven expansion.
- Real GDP grew at an annualized rate of 0.5% in Q4 2025, down sharply from 4.4% in Q3, with the revision down from the second estimate of 0.7% driven primarily by a downward revision to private inventory investment.
- Consumer spending was the primary driver of growth, contributing 1.3 percentage points to the headline figure, while fixed investment added 0.3 percentage points.
- Federal government spending subtracted about 1 percentage point.
- For 2025, real GDP grew 2.1%, driven by consumer spending and investment. In 2024, real GDP grew by 2.8%.