
This edition of the Auto Market Weekly Summary provides a deep dive on a topic introduced in Chapter 9 of the Q3 2026 Cox Automotive Sales Forecast Update.
Bottom Line Up Front
The economic news was light last week. Gas prices have continued to slowly rise, hitting $4.49 Friday morning, while diesel may have hit its ceiling for now, holding close to the all-time record set last Tuesday at $6.53. The growing concern over rising diesel prices and the knock-on economic impact has continued to raise concerns about accelerating inflation, driving Treasury yields higher, with notable gains in both the 2-year and 10-year again last week. And those fears have further increased the probability of additional rate increases through 2026 and into 2027. This week, be on the lookout for key updates on personal income and expense, as well as PCE inflation, and the jobs report for September.
I want to take this opportunity to explain a topic I introduced in the closing section of our forecast update. I’ve been working on some data to depict the impact and magnitude of financial asset growth, and why that is likely a key factor in understanding our economy, one where incomes aren’t keeping up with expense growth.
An Economy Increasingly Driven by Financial Assets, Far Outpacing Inflation
As we have pointed out many times in this series, income growth has not kept pace with expenses since 2021. Toward the end of last year, those two series were close to break even, but the conflict in the Middle East reversed that trend by fueling inflation from rising gas prices, which are now 43% higher than last year.
Yet our economy continues to grow, and the ever-resilient consumer continues to spend. Consumer spending in the Q2 GDP report is currently estimated to be higher by over 2%, the largest single component of growth, outpacing the gains seen in AI capex.
All of us talk to industry professionals and other people every week, and for years, we’ve all been fixated on “when” the consumer will finally break. Savings rates have declined, inflation continues to compound year after year, and yet restaurants are full, airplanes are packed, and generally most measures of consumer spending look to be on solid ground. It’s another reason we projected solid and steady automotive demand in our Q3 Sales Forecast Update: The consumer, against all odds, keeps showing up.
The wealth effect is a key theme that cuts across this viewpoint. We see the values of assets like homes, 401(k)s, and the stock market rise – and rise at a pace that outruns the growth of consumer debt. But most people don’t generally borrow from retirement accounts or draw down a home-equity line of credit (HELOC) for general spending, so where does the ability to fund consumer purchases stem from? Increasingly, we believe the answer is the growth of financial assets themselves, and a deep dive into the data backs that up.
Over the past several weeks, I have been utilizing some data from the Federal Reserve’s Distributional Financial Accounts (DFA). This is a quarterly series where they estimate assets and liabilities by consumer net worth groups: the Bottom 50% (bottom half), the Next 40% (50th to 90th percentile), the Next 9% (90th to 99th percentile), and the Top 1% of households. As we all know, financial and asset holdings are greatly concentrated in the top 10% of households, and this series confirms that. But we can go deeper – and that’s what I think is one of the key findings in looking at this information.
These accounts break down assets into many categories like real estate, defined benefit and contribution plans (pensions and 401(k)s), among other things. But if you dig deeper, we can measure some core categories – and ones that are typically liquid financial assets: total deposits, money market funds, debt securities (like holding a 5-year Treasury), and corporate equities and mutual fund shares. This delineation is the core finding: The stock funds held in this corporate equities and mutual fund category are “outside” of retirement accounts. So, as they grow, consumers can tap into them, or savings and money market funds, to fuel spending.
When you roll all this together, we see that these accounts collectively have grown 7.7% per year since reporting began in 1990. It’s clear to see the pullbacks from the dot-com bubble in the early 2000s and the Great Financial Crisis in 2008, but over the long run, the growth continued.
However, since the pandemic and the ensuing financial accommodation that followed, the growth rate has accelerated, as the graph shows. This grouping of financial assets has grown at a compound annual growth rate (CAGR) of 11.3% for seven consecutive years. Meanwhile, the CPI has been compounding at 3.9%. Over the same time, personal income has a CAGR of 5.7% while personal expenses grow at 6.3%.
The Wealth Effect Is Strong and Has a Buffer
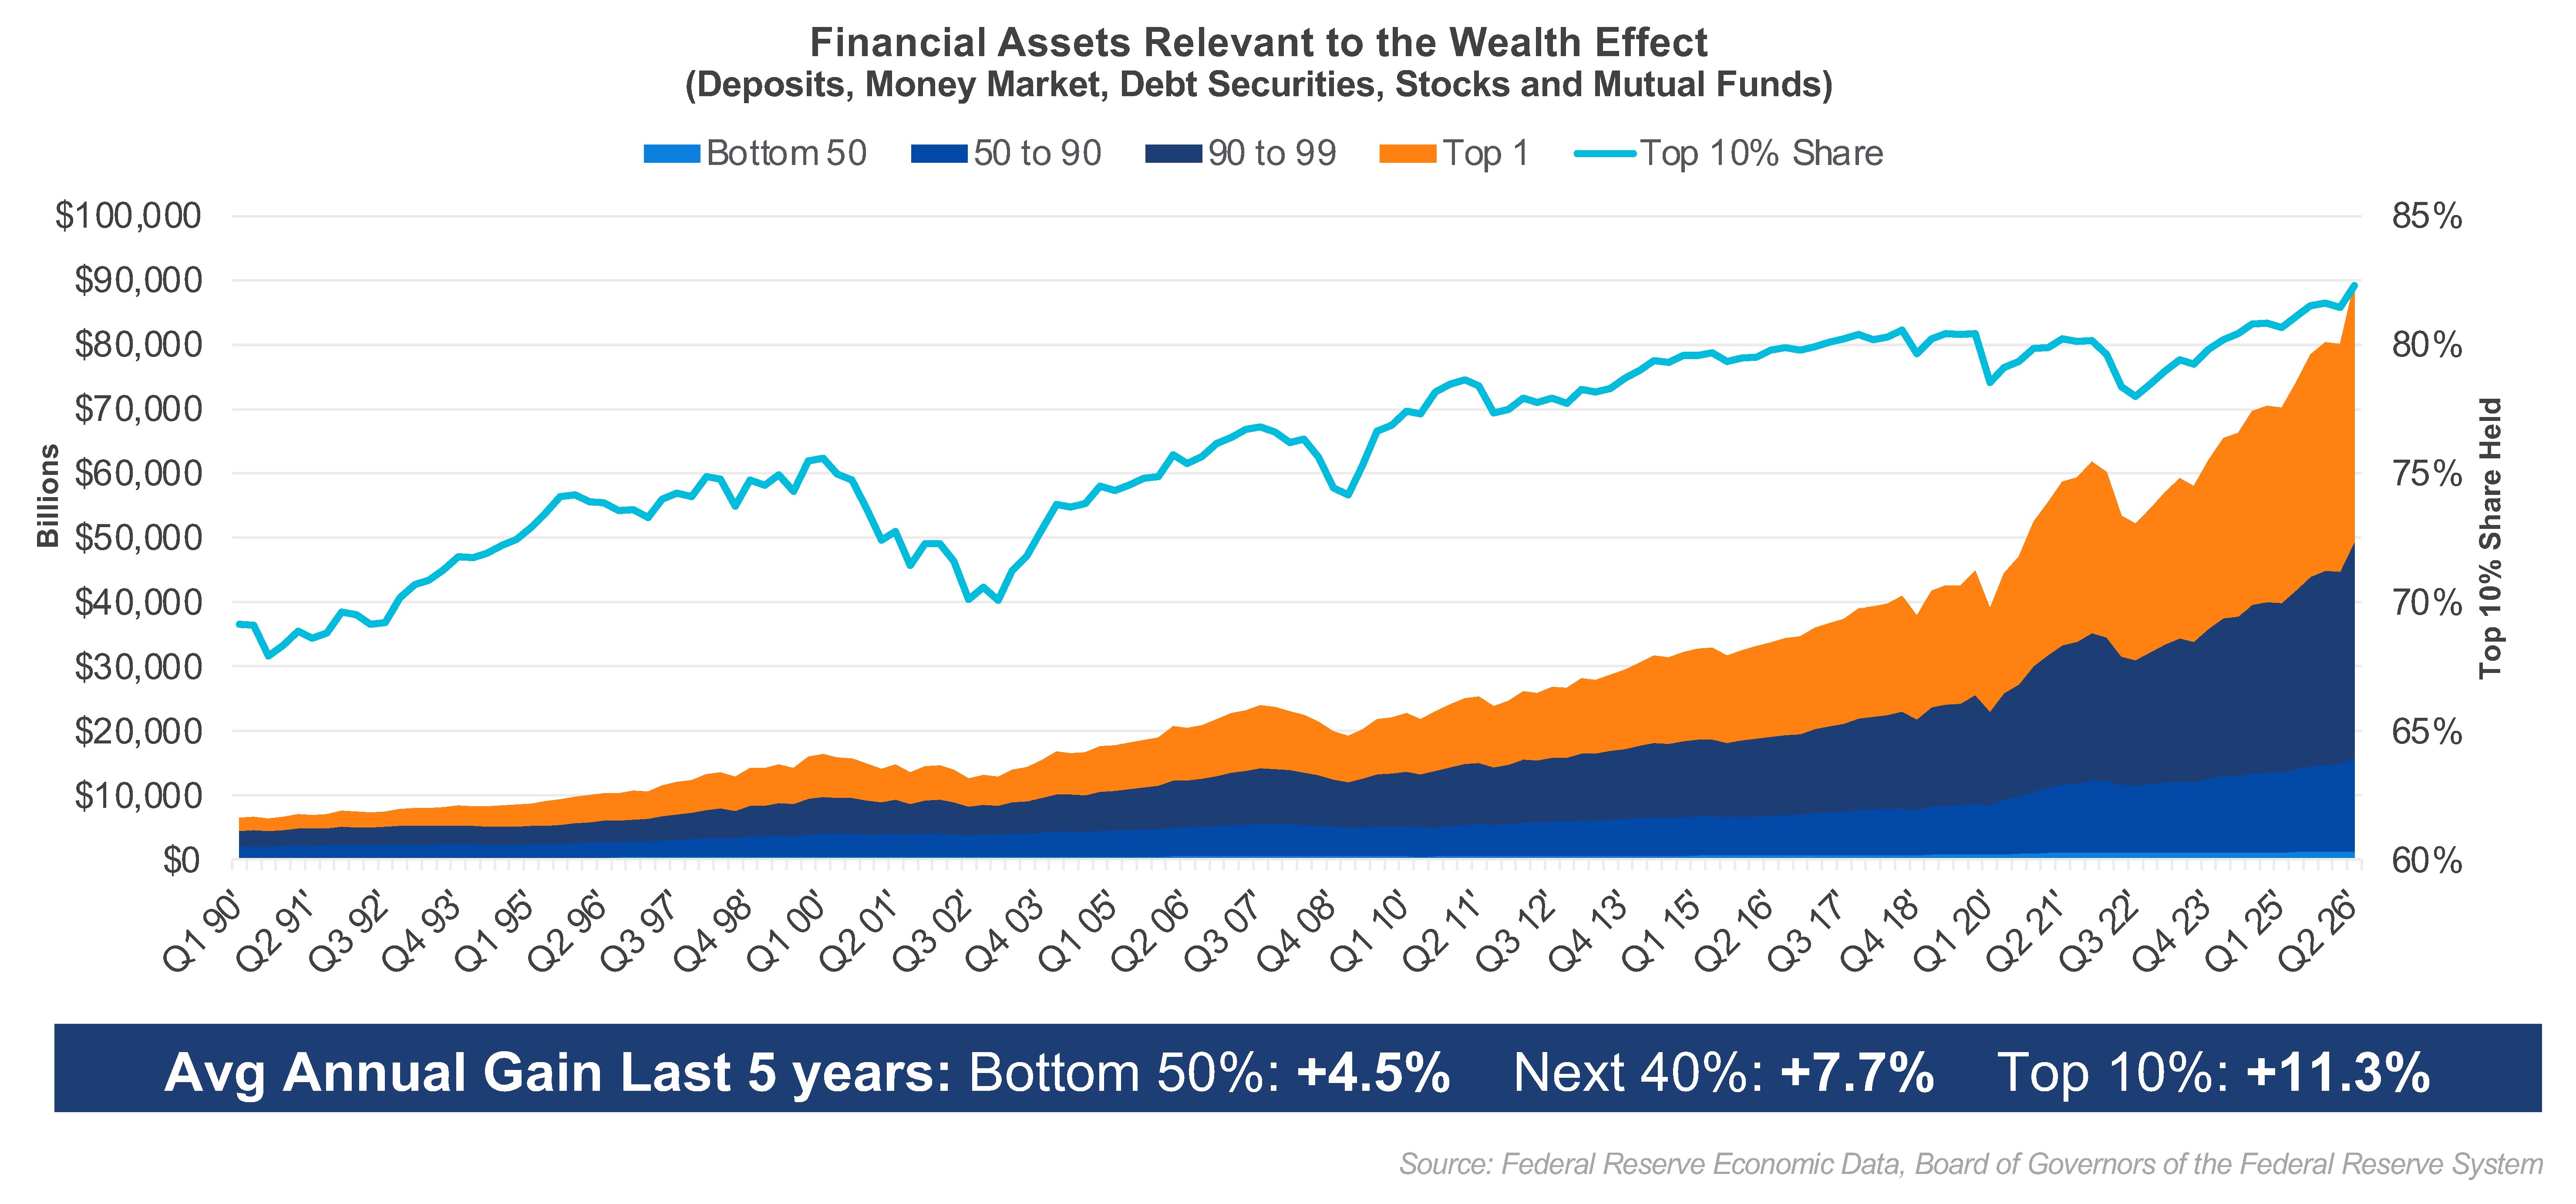
This gap between expense and income must be fueled by some part of the economy. And yes, the personal savings rate has declined from 6.8% to 3% over the same period, but savings is measured as a percentage of disposable income, which is itself growing below the rate of expense growth. Given there’s still a gap to fill, I firmly believe we are moving more toward an economy increasingly driven by the growth and holdings of financial assets. And the truth is that all consumers are benefiting. It’s just that the top 10% now own 82% of the total, up from about 75% prior to the pandemic. Yet the bottom half also participates. As the next section shows, it’s their money market holdings that have actually compounded the fastest of any group since the pandemic.
Further, the rise in interest rates has been painful for borrowers, but a cherished gift for savers. Multiple generations of consumers were never able to earn a risk-free 4 to 5% return simply by purchasing a money market fund or opening a savings account. But when the Fed rapidly increased rates in 2022, consumers responded, and money market funds have risen by 197% in total since the pandemic. And they have risen the fastest for the bottom half, compounding at 24.9% for that group.
As of the most recent data released two weeks ago, 72% of the holdings across these financial assets (again, outside of retirement accounts) are in corporate equities and mutual funds. So yes, a correction in the stock market would have a significant impact on consumers’ net worth and spending. However, we also fortified the moat around many consumers’ financial fortresses, one that will likely continue to grow as interest rates rise. As we look to the future, we need to be sure we are investigating the entire economy, with our eyes wide open to a host of driving forces. These data series shine a spotlight on that, showing an economy compounding financial wealth at more than double the pace of inflation, a trajectory I believe will have an outsized impact on where we go from here.