
This edition of the Auto Market Weekly Summary explores the growing disconnect between resilient economic activity and mounting consumer pressure, as elevated financing costs, rising fuel prices and shifting vehicle valuations collide. We examine what weakening confidence, slowing job growth, changing Fed expectations and evolving spending patterns mean for consumers, dealers and the auto market as the industry heads into the final quarter of the year.
Bottom Line Up Front
With the third quarter closed and the fourth underway, the story is not any single data point. It is how the economy and auto market connect, and what those connections mean for decision-making. Interest rates remained volatile and elevated last week, easing midweek before climbing again by Friday. That kept 30-year mortgage rates restrictive for consumers as auto loan rates increased across the board. Diesel prices remained near all-time highs, and that cost is starting to show up where it matters for dealers: wholesale valuations at Manheim. The swift and persistent rise in gas prices, driven by the conflict in the Middle East, has pushed consumer expenses much higher this year, with no clear sign of relief. Large truck and SUV values have declined over the past couple of months, while electric vehicle values have held steadier as consumers shop for fuel-efficient options. Our research shows a clear pattern: Vehicles with the worst fuel economy are depreciating fastest, while vehicles rated above 40 mpg are holding or even gaining value.
Those valuation shifts are a symptom of a larger consumer story: How long can spending keep outpacing income? The gap has widened for months, funded in large part by growth in financial assets rather than paychecks, as we discussed in the prior edition. But that gap could become harder to sustain if energy costs remain elevated and the conflict in the Middle East remains unresolved.
That expense pressure is exactly what the Fed is weighing, and last week’s data shifted the market’s view. The probability of a rate increase at the October meeting fell sharply, with the odds of no change reaching 76%, a 40-point swing. December expectations also shifted: The probability of two 25-basis-point increases by year-end fell to 20% from 51% in the prior week, while the probability of just one increase rose. Yet benchmark Treasury yields moved little, with both the 10-year and 30-year yields ending the week near their highs.
The economy continues to evolve rapidly, with AI reshaping the business landscape as demographics shift and baby boomers retire at a record pace. As year-end approaches and 2027 planning begins, the task is to understand how financing costs, energy prices, consumer balance sheets, AI-driven productivity and a changing labor force will work together in an increasingly complex marketplace.
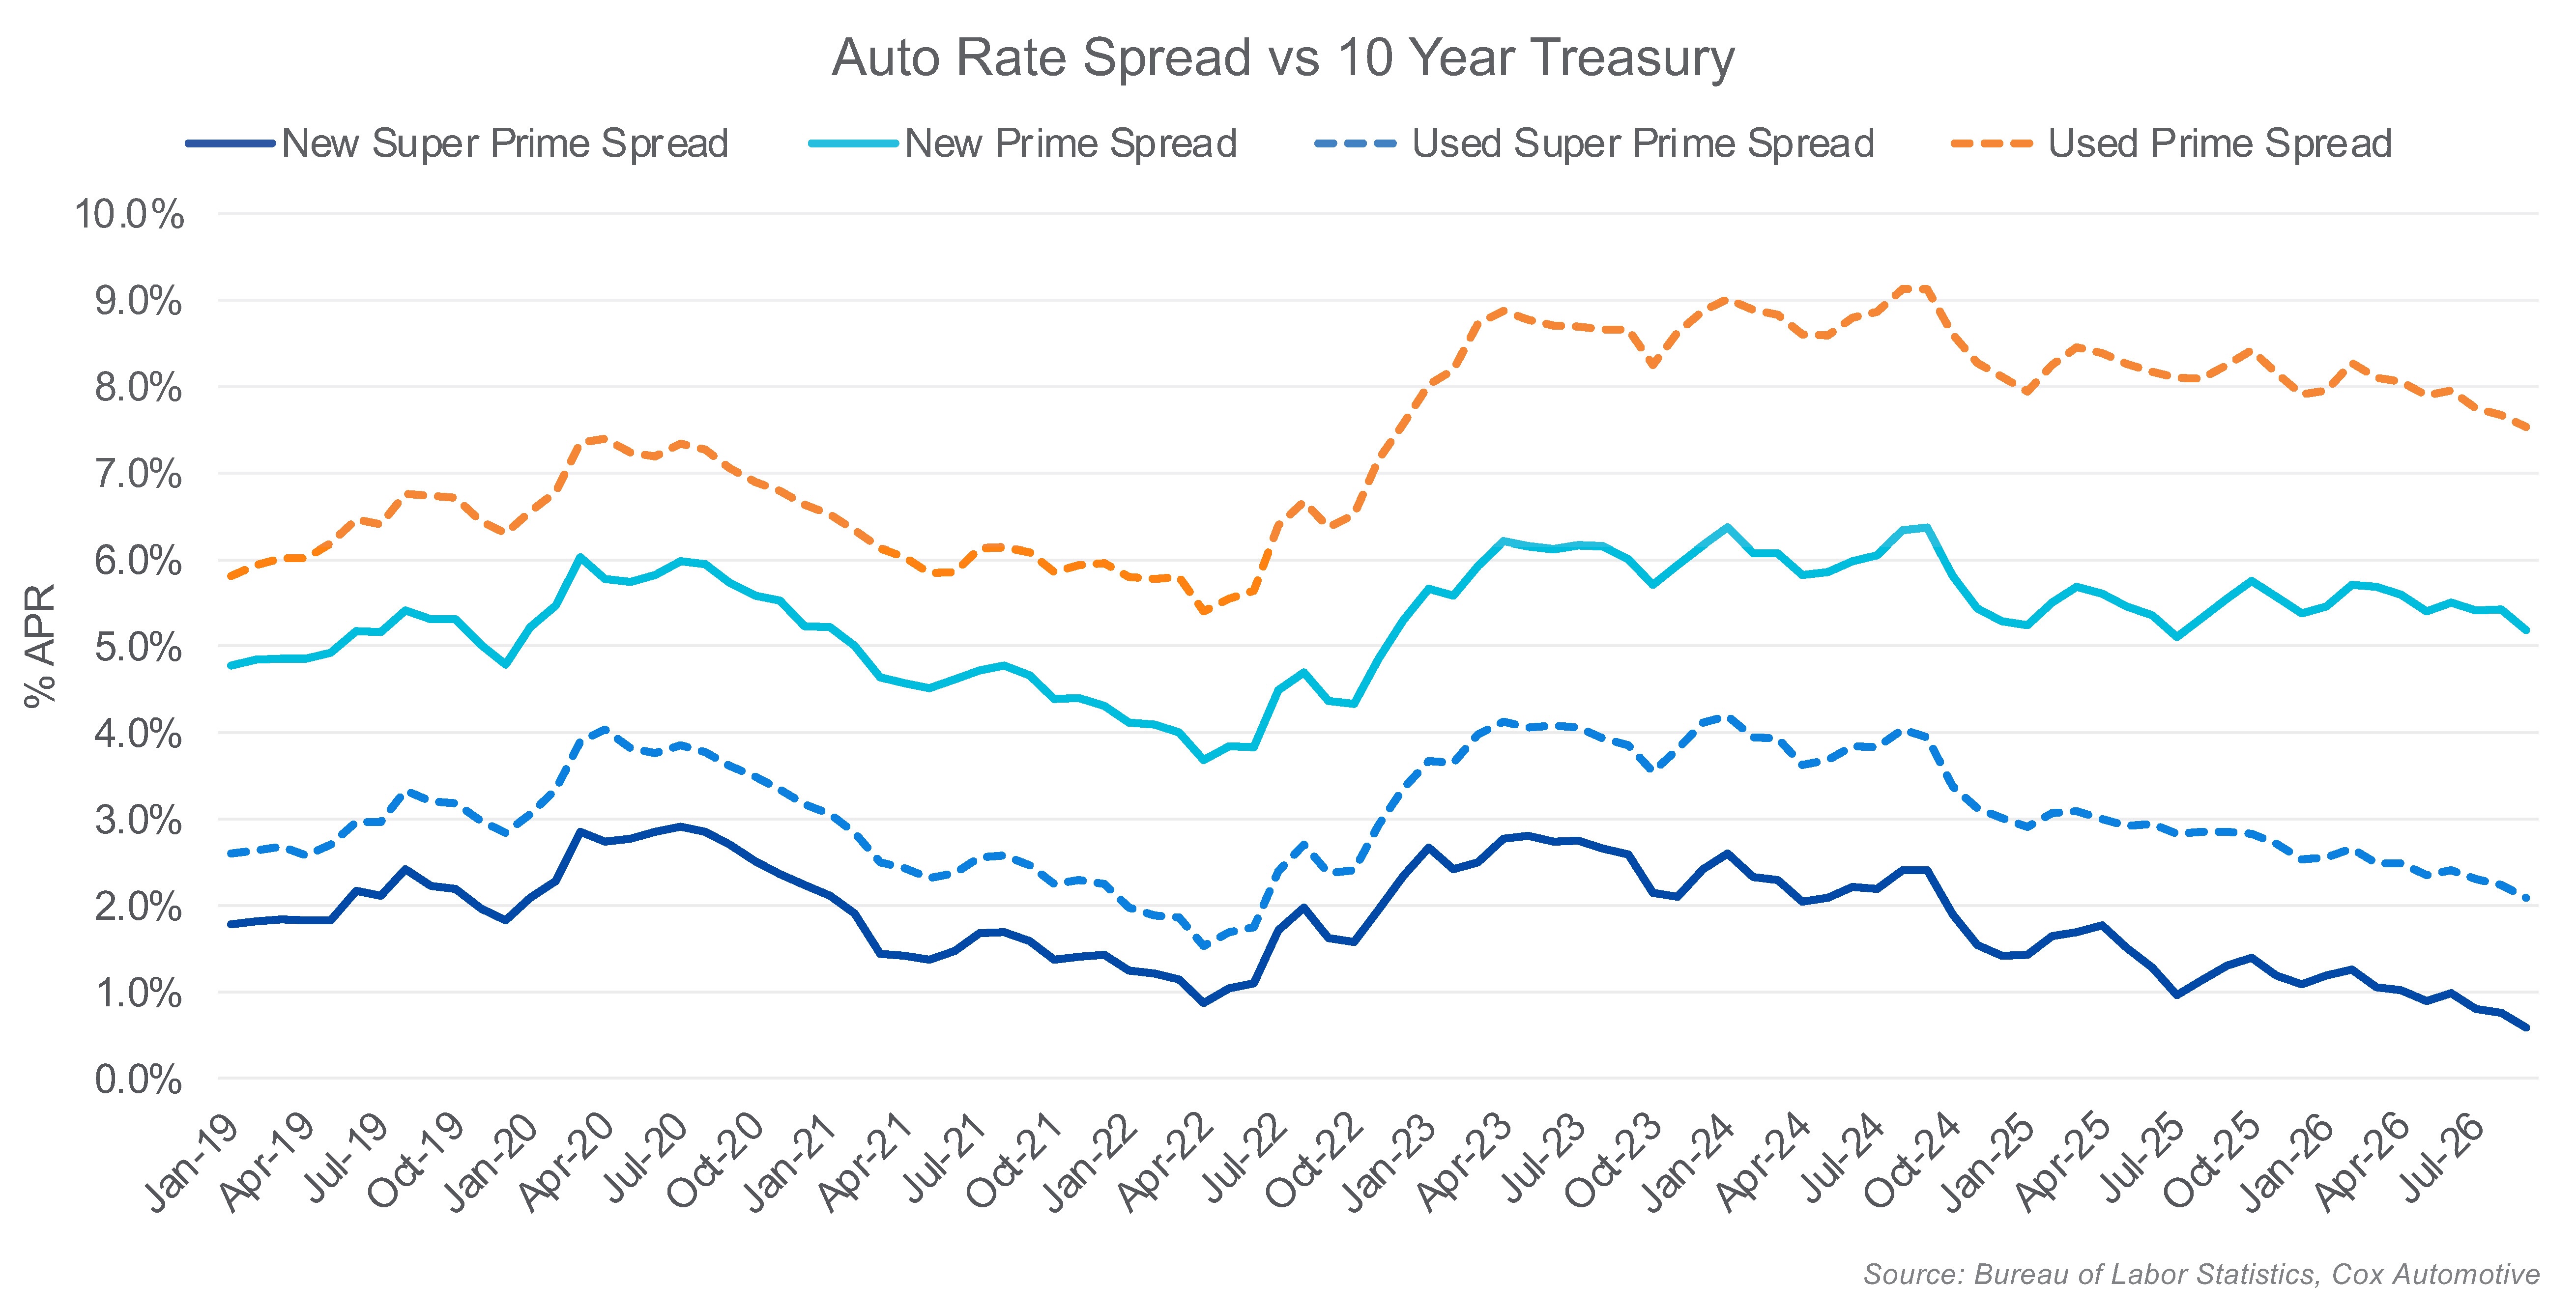
Spread Over 10-Year Treasury: Super Prime and Prime
Jobs and Unemployment
Job growth remained positive but volatile as downward revisions continued, leaving the three-month average at 51,000 jobs in September. The latest gain was well below expectations, and unemployment rose as labor force participation increased. Average earnings continued to grow, but at a rate below inflation.
- Nonfarm payrolls increased by 29,000 in September, well below the expected gain of 90,000.
- Revisions to the prior two months reduced overall job growth by 60,000, as both July and August were revised downward. The three-month average was 51,000 jobs. Over the past year, the economy added an average of only 41,000 jobs per month.
- The unemployment rate increased to 4.2% but remained 0.2 percentage points lower than a year earlier. The labor force participation rate rose for the second consecutive month, reaching 61.8%.
- Average hourly earnings growth slowed to 0.1% month over month and 3% year over year. Earnings growth remained below inflation.
Personal Income, Inflation and Spending
Income growth slowed in August even as inflation held steady and spending jumped, pushing the saving rate lower and leaving households more reliant on savings and asset growth to fund consumption.
- Personal income rose 0.2% month over month in August, down from 0.3% in July and below the expected 0.4% gain. The increase was primarily driven by compensation, led by private wages and salaries.
- The personal consumption expenditures price index rose 0.3% month over month in August, up from 0.1% in July, leaving the year-over-year rate unchanged. Core PCE, excluding food and energy, rose 0.2% month over month, up from 0.1% in July, and was 3% higher than a year earlier.
- Real disposable income was flat month over month and up 1.3% year over year, well below the 3.2% long-run average.
- Real consumer spending rose 0.6% month over month after a 0.1% gain in July, while nominal spending increased 0.9%. Durable goods led the increase, with motor vehicles and parts up 2.6%.
- With spending outpacing income, the personal saving rate fell to 4.1% from a revised 4.6% in July, compared with 5.2% a year earlier.
Consumer Confidence
Consumer confidence fell to its lowest level since 2014 in September, as surging fuel costs and a Fed rate increase during the survey period weighed on views of current conditions and the outlook.
- The Conference Board Consumer Confidence Index® fell 6.7 points to 81.9, well below the consensus forecast of 89.2.
- The Present Situation Index dropped 7.9 points to 109.3, its lowest level since February 2021. Net views of business conditions turned negative, to minus 1.9, for the first time since September 2024. The labor market differential, the share saying jobs are ‘plentiful’ minus the share saying jobs are ‘hard to get,’ narrowed to 1.7, its lowest level since early 2021.
- The Expectations Index fell 5.9 points to 63.6, its 20th consecutive month below the 80 threshold that typically signals a recession ahead. Net expectations for business conditions and the labor market worsened, while net expectations for household income remained positive at 2.5.
- Average 12-month inflation expectations rose 0.3 points to 6.1%, and the share of consumers expecting higher interest rates over the next year jumped 5.2 points to 68.4%.
GDP
Real GDP growth was revised higher in the third estimate, and the annual update also lifted first-quarter growth, suggesting the first half of 2026 was firmer than previously reported.
- Real GDP grew at a 2.2% annualized rate in the second quarter, up 0.7 percentage points from the second estimate of 1.5% and above the consensus forecast of 1.6%. First-quarter growth was revised to 2.5% from 2.1%.
- Consumer spending contributed 2.51 percentage points, up from 0.49 in the first quarter. AI-related investment, reported under nonresidential fixed investment, added 1.25 points, down from 1.36 in the revised first-quarter report.
- Real final sales to private domestic purchasers rose 4.6%, revised up 0.4 percentage points, suggesting underlying private demand was stronger than the headline figure.
- Real gross national income also accelerated, rising at an annual rate of 2.9%, up from 1.7% in the first quarter.