Key Metrics
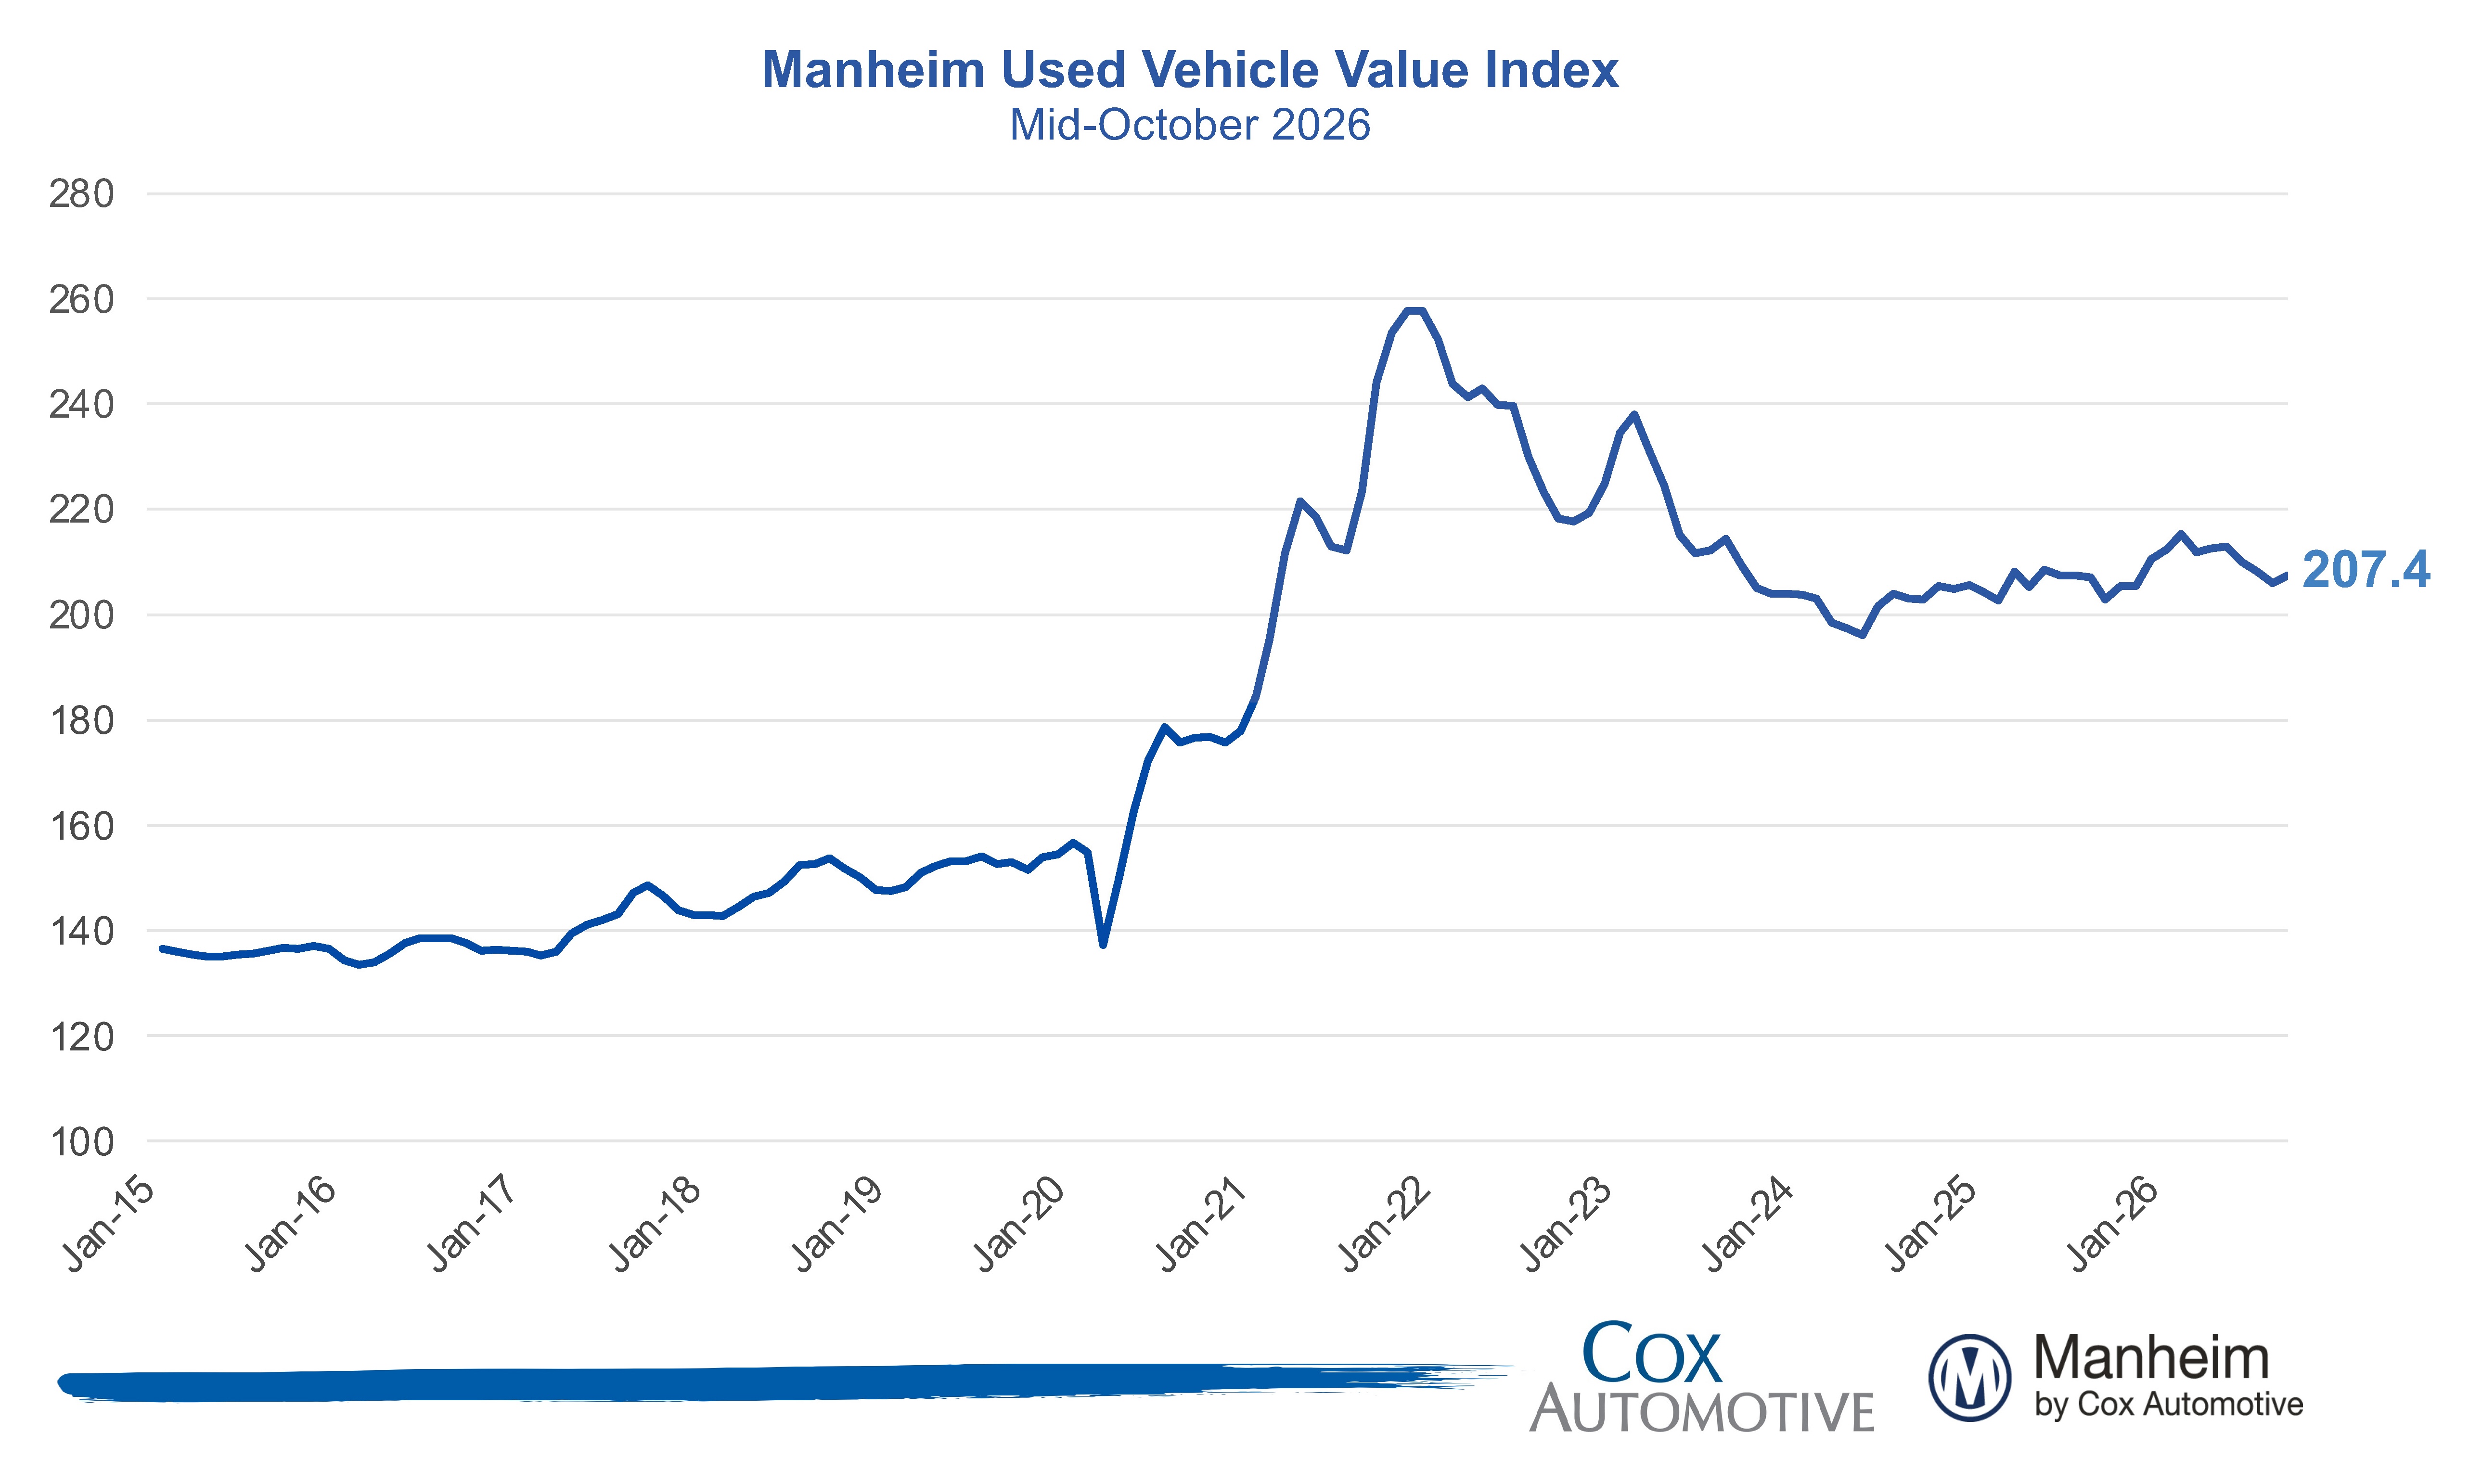
- Manheim Used Vehicle Value Index (MUVVI) rose to 207.4, reflecting a 0.7% increase in wholesale used-vehicle prices (adjusted for mix, mileage, and seasonality) in the first 15 days of October compared to September. The Manheim index is now higher by 2.2% compared to October 2025, rebounding after the softening seen in the third quarter of the year.
- Non-adjusted wholesale vehicle prices decreased 2% in the first half of October from September and are up 0.5% year over year. The long-term average monthly move in non-adjusted values is typically a decrease of 1.5% for the full month of October.
Expert Perspective — Jonathan Gregory, Senior Director, Cox Automotive
“After a September that depreciated faster than normal, wholesale values firmed in early October. The Manheim Index rose 0.7% to 207.4 through mid-month, but prices didn’t climb. Non-adjusted values still fell 2%, a pace October generally brings. Much of the 2.2% year-over-year gain reflects an easy comparison. Last October was unusually weak, and that low base boosts the annual figure now, much as last summer’s strong base held it down.
Supply, not demand, appears to be what slowed depreciation. Wholesale days’ supply fell from 28.7 to 28.2 days, and the gap compared to last year narrowed from 2.5 days to about one day. Dealer demand, meanwhile, is roughly flat: Sales conversion is only slightly above last year, and retention eased. The firmer values reflect leaner inventory rather than stronger buying, a more stable footing, but not a buyer-driven recovery.
The mix of what’s holding values up is shifting. EVs have outperformed all year on sustained demand for fuel-efficient vehicles, but so far this month, Non-EV values rose 0.7% while EVs slipped 0.7%. EVs remain up 6.8% year over year, though momentum is fading as more off-lease EVs come to market. Fuel efficiency and affordability continue to drive segment performance. Compact cars are up 5.6%, and midsize cars have turned positive. Luxury is now slightly below last year after being a first-half leader, and pickups remain soft.
This strong start to October cannot undo a soft third quarter. The trends we flagged in September haven’t gone away: higher rates and weaker sentiment. If anything, we might have seen some of the weakness we expect to see in October pulled ahead into September after a stronger-than-expected first half. October has started on steadier ground, but we will need the full month to know whether it will hold.”
MMR Prices, Retention & Sales Conversion
- MMR prices for the Three-Year-Old Index were down 1.2% since the beginning of October, slightly less than last year’s trend for the same period. Overall, MMR depreciation was consistent with the long-term average in the first half of October.
- MMR retention averaged 98.9% in the first half of October, lower by 0.1 points year over year and down 0.4 points from September.
- Sales conversion averaged 54.3% in the first half of October, higher by 0.3 points year over year but down 0.3 points from September.
Takeaway: MMR retention eased in the first half of October but remains within seasonally normal levels, while sales conversion improved slightly year over year despite a small decline from September.
Segment Performance: Year-Over-Year Price Changes
Prices in the overall market were up year over year, with broad-based strength led by Compact Cars and EVs more than offsetting slight weakness in Luxury and Pickups.
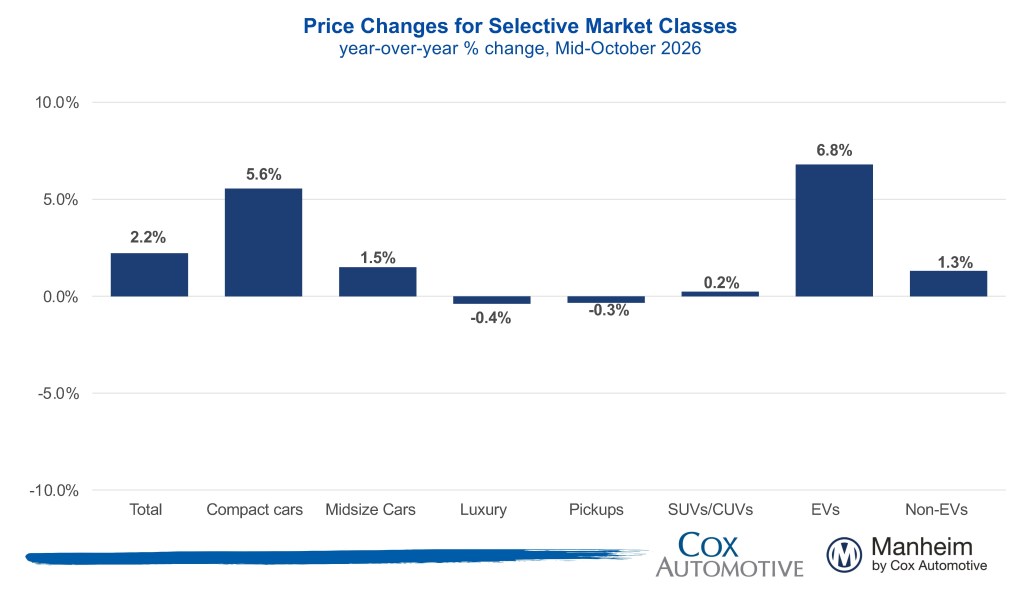
Takeaway: Compact cars and EVs continue to show strength relative to last year, against a backdrop of persistently elevated gas prices. Most other segments have also turned positive year over year.
EV versus Non-EV Index
- EVs: The EV Index was up 6.8% year over year but down 0.7% from September.
- Non-EVs: The Non-EV Index was up 1.3% year over year, and higher by 0.7% against September.
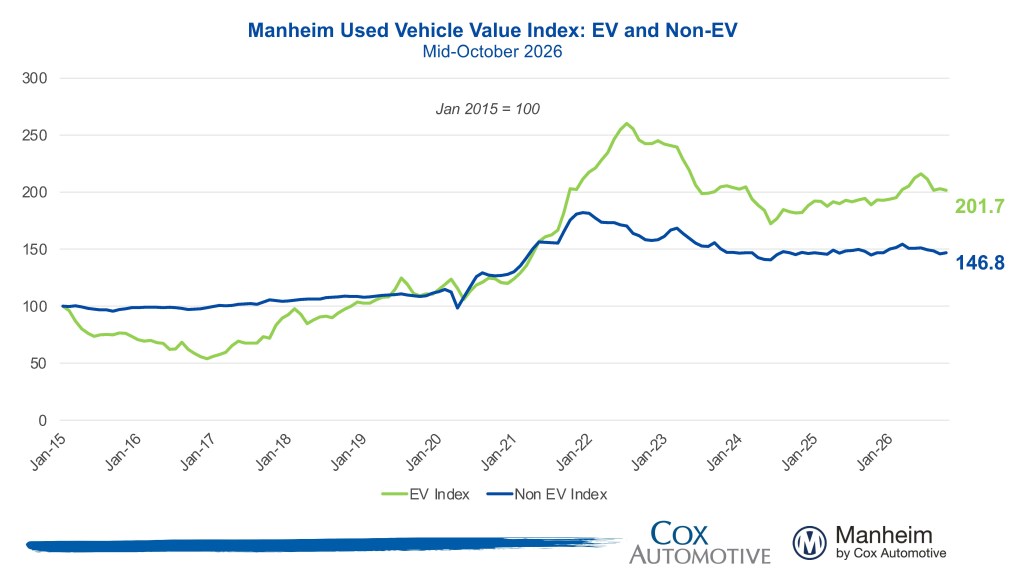
Takeaway: EV values have strengthened year over year as elevated gas prices continue to drive buyer interest, while Non-EV values have also turned positive.
Wholesale Supply
- At the end of September, wholesale vehicle supply reached 28.7 days, up 2.5 days against September 2025 and higher by 1.4 days against the end of August. As of Oct. 15, days’ supply fell to 28.2 days and is up one day against last year.
Takeaway: Wholesale used-vehicle days’ supply has decreased in the first half of October and remains higher against last year.
View historical MUVVI reports here.
For more information on Manheim, visit Manheim.com.
The Manheim Used Vehicle Value Index (MUVVI) is a trusted benchmark for tracking wholesale used-vehicle prices in the U.S., which helps dealers and analysts gauge market shifts and anticipate retail trends. The official measure is reported on the fifth business day of each month. The next complete suite of monthly MUVVI data will be released on Nov. 6, 2026.
For questions or to request data, please email manheim.data@coxautoinc.com. If you want updates about the Manheim Used Vehicle Value Index, as well as direct invitations to the quarterly call sent to you, please sign up for our Cox Automotive newsletter and select Manheim Used Vehicle Value Index quarterly calls.
Note: The Manheim Used Vehicle Value Index was adjusted to improve accuracy and consistency across the data set as of the January 2023 data release. The starting point for the MUVVI was adjusted from January 1995 to January 1997. The index was then recalculated with January 1997 = 100, whereas prior reports had 1995 as the baseline of 100. All monthly and yearly percent changes since January 2015 are identical. Learn more about the decision to rebase the index.