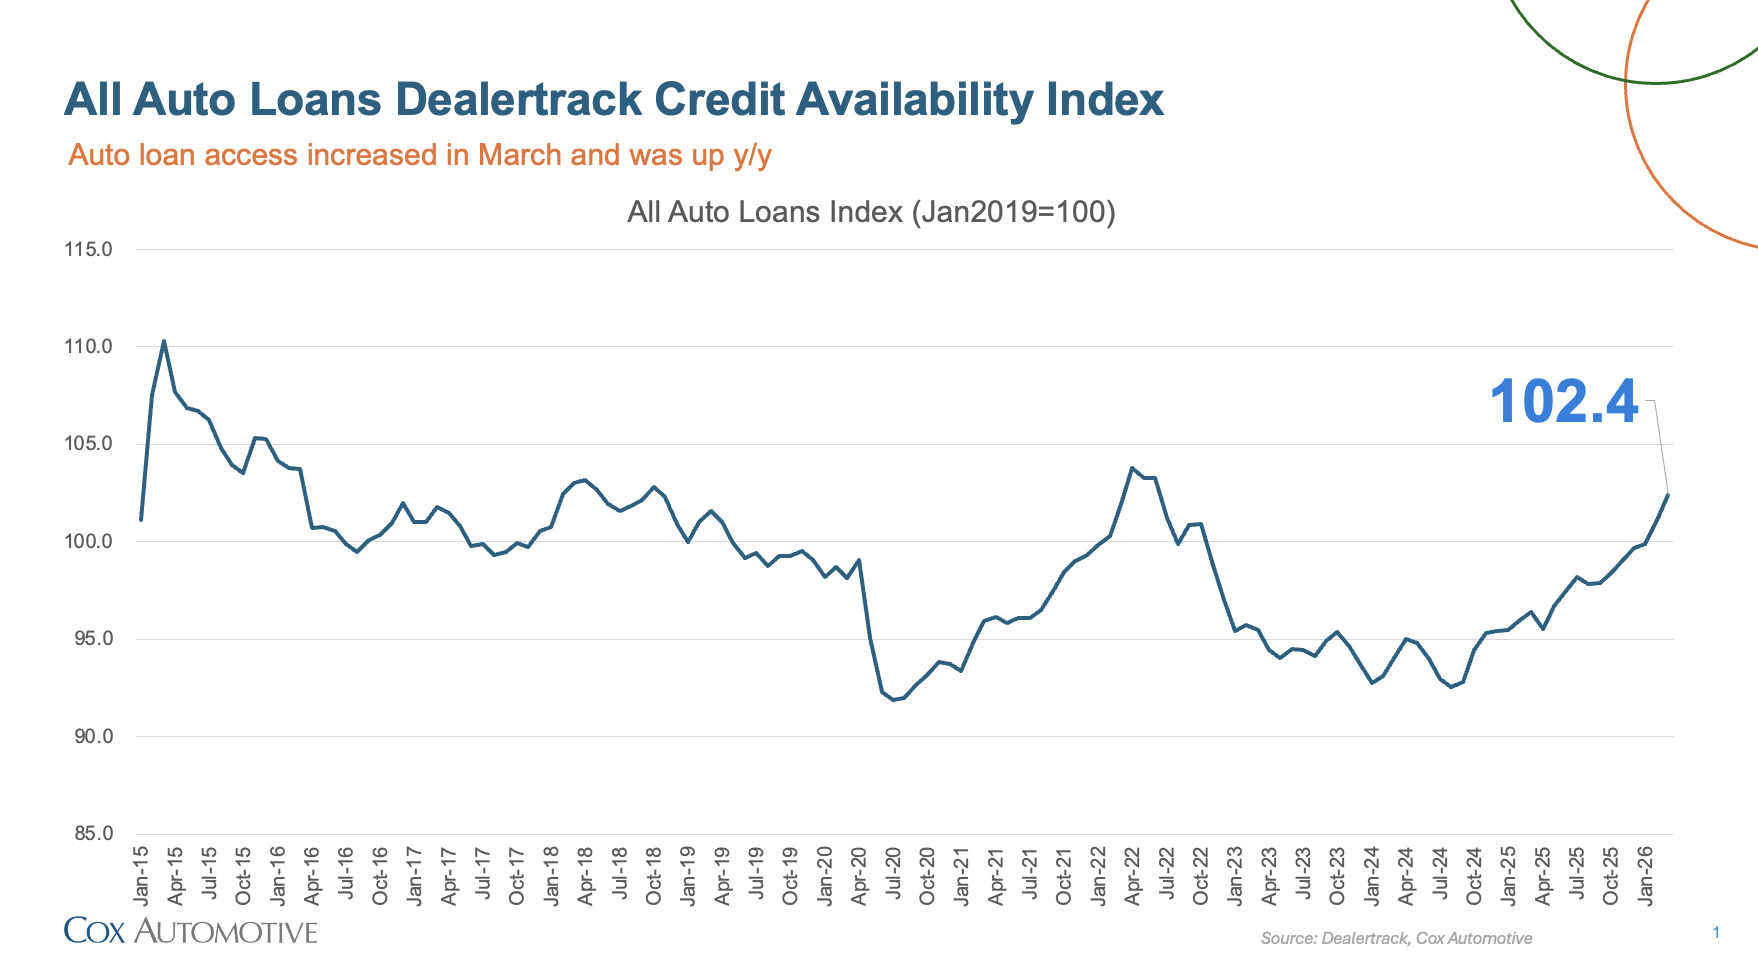
In March 2026, the Dealertrack Credit Availability Index rose to 102.4, its best reading since June 2022. The All-Loans Index increased 1.3% from February’s 101.1 and is up over 6% from March 2025. Even as yield spreads widened, the month’s improvement was broad-based across all channels and lender types, driven primarily by a significant expansion in subprime lending, a recovery in approval rates, and strong gains from banks.
Key Metrics
- Approval Rates: The approval rate for auto loans rose to 70.8% in March, up 40 basis points (bps) from February, reversing a two-month declining trend. Approval rates remain down 180 bps from March 2025 (72.6%), even as most lenders continued to expand access broadly.
- Subprime Share: The share of loans to subprime borrowers increased by 200 bps month over month (from 17.5% to 19.5%) and is up 300 bps year over year. March’s reading of 19.5% is the highest level in the dataset since March 2020. This sustained expansion suggests lenders are increasingly comfortable extending credit to higher-risk borrowers.
- Yield Spread: The yield spread widened by 31 bps (from 7.53 to 7.84), while the average contract rate rose 50 bps (from 11.2% to 11.7%). The 5-year Treasury yield increased by 17 bps (from 3.68% to 3.85%). This widening spread represents less favorable pricing for consumers and may reflect lenders charging a premium to offset the increased risk from higher subprime lending and elevated negative equity.
- Loan Term Length: The share of loans with terms greater than 72 months decreased by 50 bps (from 29.3% to 28.8%), breaking a three-month streak of increases, and is up 510 bps year over year. February’s 29.3% remains the all-time high in the dataset; at 28.8%, March’s reading is the second highest on record and continues to reflect ongoing affordability pressures as consumers opt for longer terms to manage monthly payments.
- Negative Equity Share: The proportion of borrowers with negative equity increased by 120 bps month over month (from 58.0% to 59.2%) and is up 620 bps year over year, pushing the share to a new all-time high for the third consecutive month and signaling increased risk as more borrowers carry loan balances that exceed their vehicle’s value.
- Down Payment Percentage: The average down payment percentage increased by 30 bps (from 13.6% to 13.9%) but is down 80 bps year over year. This modest increase may reflect lenders requiring slightly more upfront capital or consumers voluntarily putting more down, though down payments remain below year-ago levels.
Channel and Lender Trends
- Channels: Credit access improved across all sales channels in March. The largest gains were in the Non-Captive New segment, followed by All New. Franchise Used, All Used, CPO, and Independent Used also saw improvement.
- Lender Types: Lender performance was broadly positive in March. Banks led the improvement with credit availability rising 5.2%, the largest monthly gain among lender types. Credit Unions reversed their prior month’s decline, up 2.9%. Captives continued to improve, rising 1.4%, while Finance Companies were essentially flat. Overall, lenders are showing continued willingness to extend credit, with banks driving the month-over-month improvement.
Year-Over-Year Comparison
Compared to March 2025, credit access was looser across all channels and lender types:
- Channels: The most notable year-over-year improvements were in Franchise Used, All New, and Non-Captive New, indicating stronger credit availability across both new and used vehicle segments. All Used and Independent Used also saw solid improvement, while CPO saw more modest gains.
- Lender Types: Captives and Banks led the year-over-year loosening, while Finance Companies also improved. Credit unions showed a more cautious yet still positive stance on credit access compared with a year ago.
Implications for Consumers and Lenders
- Consumers: Credit access continued to broaden in March, with improvement across all channels and lender types offering financing opportunities in both new and used markets. However, the underlying picture carries increasing caution. Record negative equity, a sharply rising subprime share, and widening yield spreads all point to elevated borrowing costs and greater long-term financial risk. Consumers should carefully consider the full terms of any financing offer, particularly total loan length and overall cost.
- Lenders: Banks led the market in March, posting the strongest monthly gain among lender types. Captives also continued to improve, with their index reaching its highest level since April 2022, while credit unions reversed their prior month’s decline. With negative equity reaching a new all-time high, lenders increasing exposure in this environment face growing collateral risk, and balancing volume growth with disciplined underwriting will be increasingly important as these risk indicators continue to build.
Overall, the March Dealertrack Credit Availability Index reflected continued improvement in auto credit access, with the headline index climbing to 102.4, its best level since June 2022. Individual metrics told a more complex story, however. Subprime lending reached its highest level since March 2020, approval rates recovered modestly, and banks posted the strongest monthly gain among lender types. Yet negative equity reaching another new high and widening yield spreads point to growing risk beneath the surface.
View historical Dealertrack Credit Availability Index reports.
The Dealertrack Credit Availability Index tracks six factors that affect auto credit access: loan approval rates, subprime share, yield spreads, loan term length, negative equity and down payments. Reported monthly, the index indicates whether access to auto credit is improving or declining. This typically means that it is cheaper and easier for consumers to obtain a loan or more expensive and harder. The index is published around the tenth of each month.