
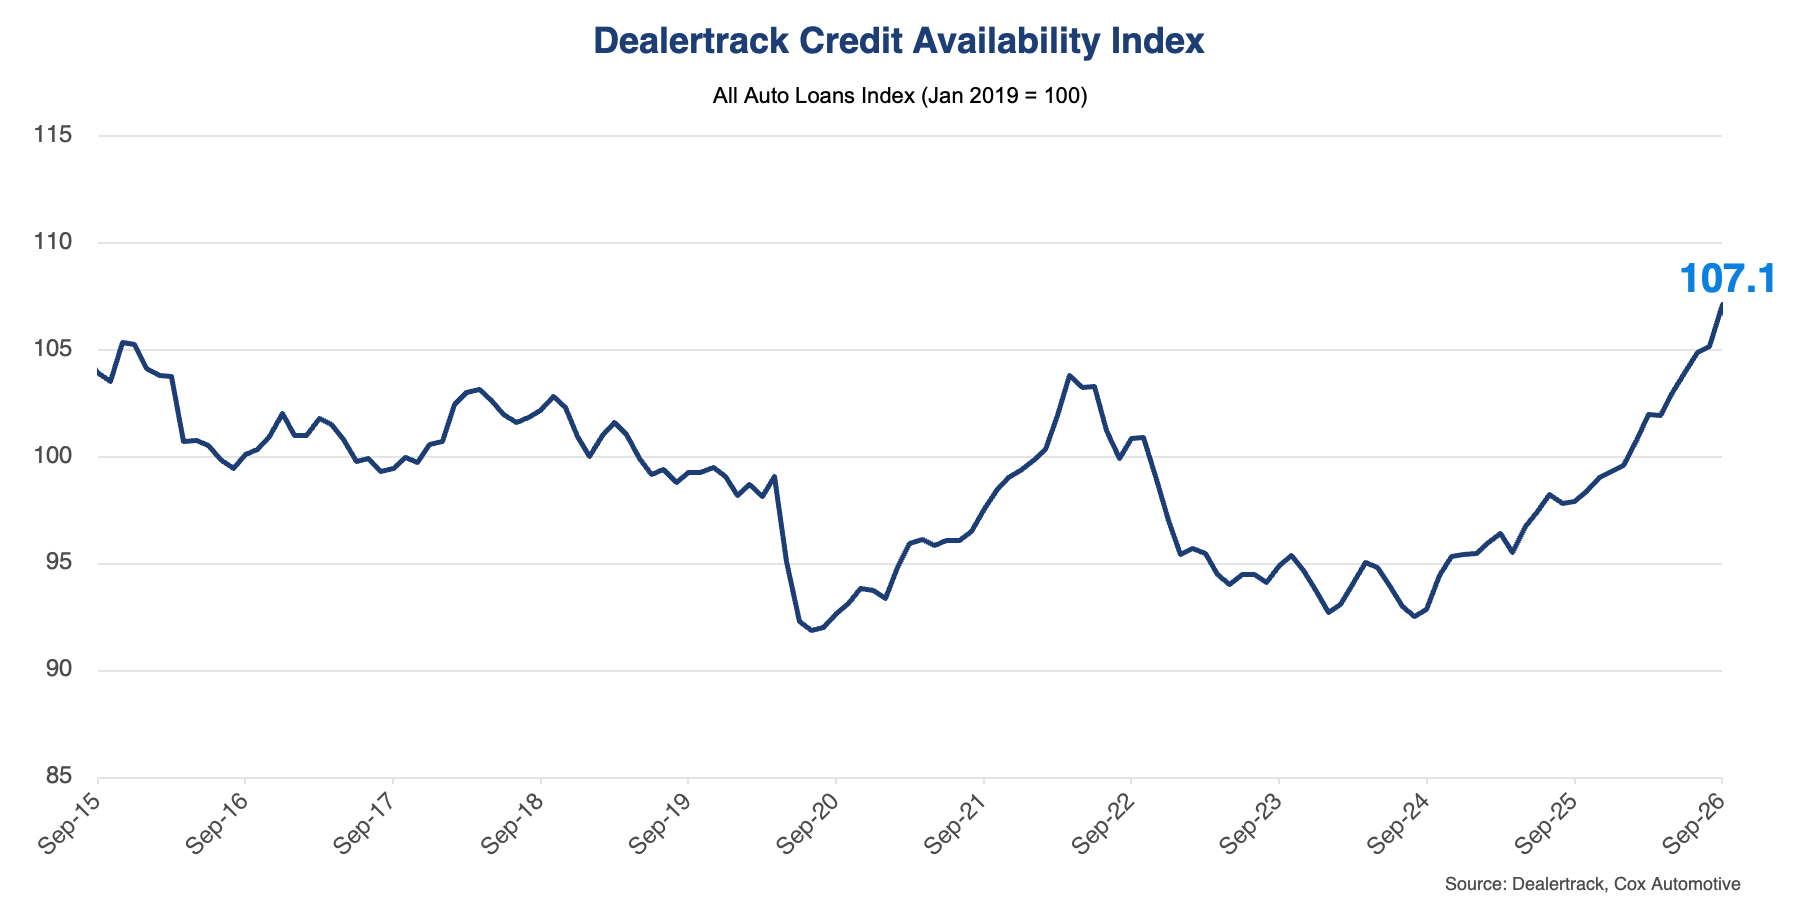
Auto credit access improved for a fifth consecutive month in September, reaching its highest level since April 2015, according to the Dealertrack Credit Availability Index. The All-Loans Index increased 1.9% to 107.1 from 105.1 in August and was 9.4% higher than in September 2025.
Every component of the index contributed to the September gain. A higher subprime share was the largest contributor, followed by a narrower yield spread. The monthly gain also reflected continued loosening in loan structures, including a higher share of long-term loans and increased negative equity.
Key Metrics
- Approval Rates: After climbing 170 basis points in June and 120 basis points in July, then holding flat in August, the overall loan approval rate rose 30 basis points to 73.9% in September, its highest level since August 2025. The rate was 20 basis points above the 73.7% recorded a year ago, and the increase came as applications fell slightly faster than approvals.
- Subprime Share: The share of loans to subprime borrowers rose to 17.4% in September, an increase of 80 basis points from August and the second consecutive increase. Subprime loan volume was little changed from August, so the higher share reflects fewer loans to other borrowers. Year over year, the share was up 230 basis points from 15.1%. The rise was the single largest contributor to September’s index gain.
- Yield Spread: The yield spread narrowed 19 basis points, from 6.61% to 6.42%, its lowest level since December 2024. The average contract rate rose 23 basis points to 11.22%, but the 5-year Treasury yield rose 42 basis points to 4.80%, its highest level since July 2007. Year over year, the spread was 101 basis points below the 7.43% recorded in September 2025. The narrowing was the second-largest contributor to the September index gain.
- Loan Term Length: The share of loans with terms longer than 72 months rose to 31.8% in September, up 60 basis points and a record high in the dataset. The increase was broad, with longer terms rising across all credit tiers and lender types. It was the fourth consecutive month at or above 31%. Year over year, the share was up 490 basis points from 26.9% in September 2025.
- Negative Equity Share: The share of loans with negative equity rose to 57.8%, an increase of 40 basis points and the second consecutive increase. Part of the increase reflects a larger subprime share of the borrower pool, since subprime borrowers carry far more negative equity, while the rest reflects modest increases across most channels. It was the highest reading since April’s 58.5%. Negative equity was 540 basis points above the 52.4% recorded a year ago and above every monthly reading recorded from 2015 through 2019.
- Down Payment Percentage: Down payments slipped to 12.8% in September, down 20 basis points from August and the lowest level since September 2022. The decline was broad, with lower down payments across all channels and lender types. The share was 70 basis points below the 13.5% recorded in September 2025.
Channel and Lender Trends
- Channels: Credit access improved across every channel in September. All Used posted the largest monthly gain, up 2.0%, followed by Independent Used, up 1.8%, and All New, up 1.7%. Franchised Used rose 1.5% and Non-Captive New rose 1.1%. Certified pre-owned rose 0.8% to its best reading since October 2022. All Used, Independent Used and Franchised Used each set series highs.
- Lender Types: All four lender types posted gains in September. Captives rose 4.1%, the largest monthly gain and a new series high, followed by Credit Unions, up 3.1% to their best reading since October 2022. Banks rose 1.8%, and Finance Companies rose 1.2%, also a new series high.
Year-Over-Year Comparison
- Channels: All New posted the largest year-over-year gain, up 10.8%, followed by Independent Used, up 8.1%. All Used improved 7.6%, Franchised Used rose 7.4%, and Non-Captive New increased 6.6%. Certified pre-owned posted the smallest year-over-year gain, up 5.1%.
- Lender Types: Captives led the year-over-year improvement, up 20.2%, followed by Banks, up 13.2%. Credit Unions improved 11.1%, and Finance Companies increased 8.5%. All four lender types remained well above year-ago levels.
Implications for Consumers and Lenders
As vehicle prices have continued to rise this year, loan structure is where the pressure is showing up. Longer terms can lower the monthly payment, while smaller down payments and financing above a vehicle’s value reduce the cash borrowers need up front. All three moved further in that direction in September. Loans booked in September leaned more toward these structures than those booked in August, giving borrowers more ways to fit a vehicle into their budget.
- Consumers: Consumers continued to use longer terms, smaller down payments and negative equity in September, with a record 31.8% of loans exceeding 72 months. These structures can make a purchase easier to fit into a budget, but the flexibility borrowers gain up front comes at the cost of flexibility later. Higher total borrowing costs, more time underwater and a larger balance relative to the vehicle’s value leave less room to sell or trade the vehicle if income, expenses or other circumstances change.
- Lenders: The index reached its highest level since April 2015 because credit loosened through loan structure and a higher subprime share, while the yield spread narrowed. The spread narrowed because the contract rates increased less than the 5-year Treasury yield, which could reflect competitive pricing or contract rates that have not yet caught up with higher Treasury yields. Lenders are taking on more risk through a higher subprime share, longer terms and more negative equity, which raises potential losses if borrowers default, while earning a smaller spread over Treasury yields. If Treasury yields continue to rise faster than contract rates, that combination becomes harder to sustain. If contract rates rise to catch up, however, higher payments could make vehicles more difficult for borrowers to fit into their budget, leaving lenders with limited room to maneuver.
Bottom Line: The September 2026 Dealertrack Credit Availability Index rose for a fifth consecutive month to 107.1, its highest level since April 2015. All six components contributed to the gain, led by higher subprime share and a narrower yield spread. The month also brought a record share of loans longer than 72 months and an increase in negative equity to 57.8%.
View historical Dealertrack Credit Availability Index reports.
The Dealertrack Credit Availability Index tracks six factors that affect auto credit access: loan approval rates, subprime share, yield spreads, loan term length, negative equity and down payments. Reported monthly, the index indicates whether access to auto credit is improving or declining. This typically means that it is cheaper and easier for consumers to obtain a loan or more expensive and harder. The index publication timing is shifting to around the 10th of each month.