October brought mixed signals to the electric vehicle (EV) market. New EV sales posted their first year-over-year gain in 2026 but declined from September, while used EV sales rose on both measures. Days’ supply increased for both new and used EVs, narrowing the gap with internal combustion engine and hybrid (ICE+) vehicles, while new EV prices edged higher and used EV prices moved in the opposite direction.
New and Used EV Sales – October
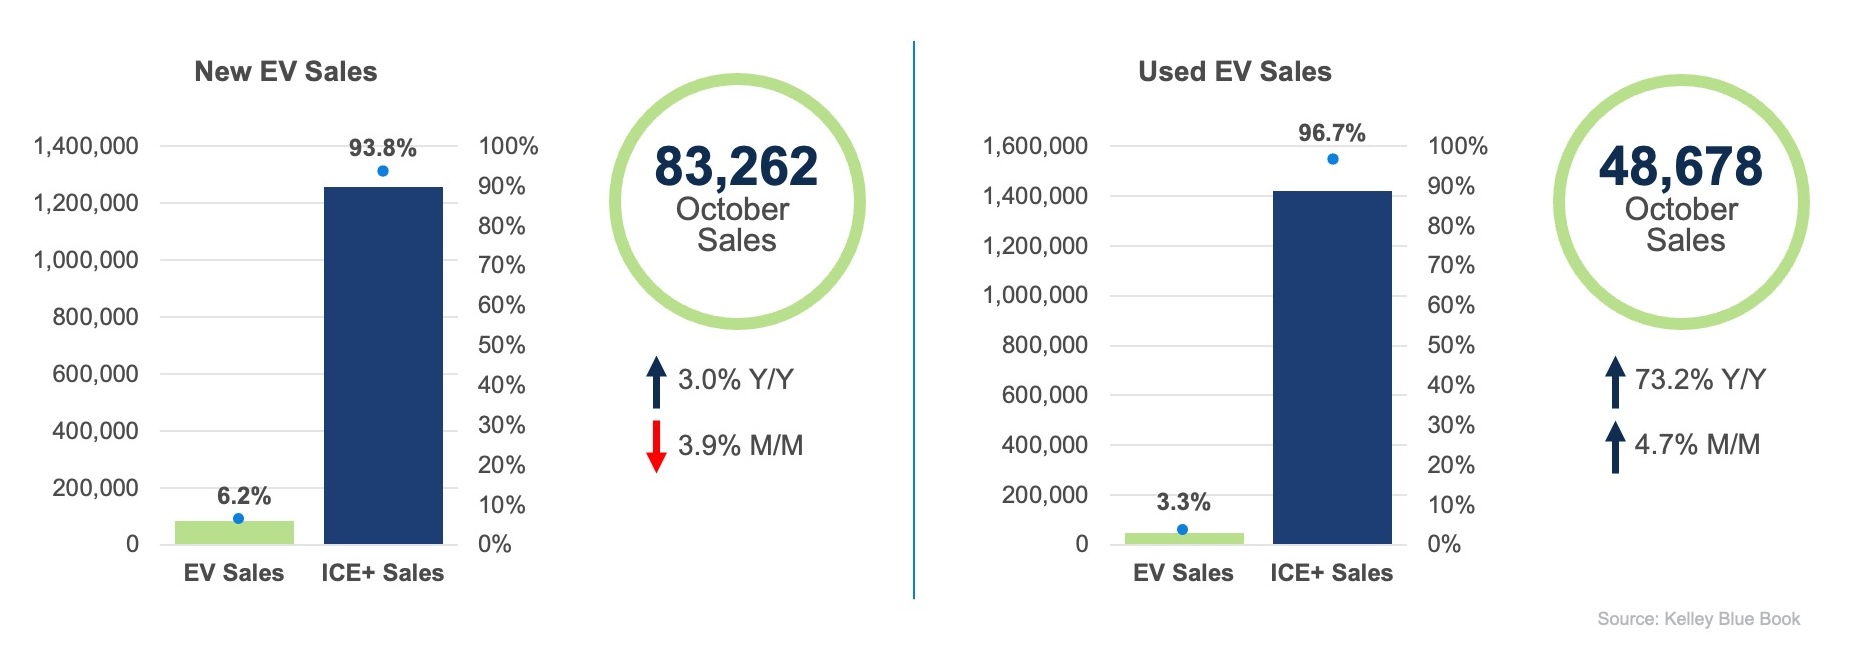
New EV Sales: New EV sales totaled an estimated 83,262 units in October, up 3% from a year earlier but down 3.9% from September. It was the first year-over-year increase in 2026. October was also the first comparison against a period after the federal tax credit expired. EVs accounted for 6.2% of total new-vehicle sales, down from 6.3% in October 2025 and 6.5% in September. A year ago, sales in October 2025 totaled 80,843 units.
Tesla remained the top-selling EV brand with 47,850 units sold, down 1.1% month over month, followed by Rivian, Cadillac and Chevrolet. Tesla’s share of EV sales increased to 57.5%, up 1.6 percentage points from September. The Tesla Model Y remained the market’s leading EV, with sales increasing 9.4% month over month to 36,366 units, accounting for nearly 44% of all new EV sales.
Used EV Sales: Used EV sales increased 73.2% year over year and 4.7% month over month in October to an estimated 48,678 units. Used EV share was 3.3% of total used-vehicle sales, well above 2% in October 2025 and essentially unchanged from September. The expanding supply of used EVs, including off-lease vehicles, continues to support sales growth while broadening the selection of makes and models available to consumers.
Tesla remained the top-selling used EV brand, despite sales declining 5.4% month over month. Chevrolet, Ford, Hyundai and BMW rounded out the top five in October. At the model level, the growing diversity of choice can be seen, as top-selling used-EVs, including the Tesla Model 3 and Model Y and Ford Mustang Mach-E posted notable declines, as sales of the Chevrolet Equinox EV and Blazer EV, Kia EV6, Nissan Leaf and Volkswagen ID.4 grew notably.
New and Used EV Days’ Supply – October
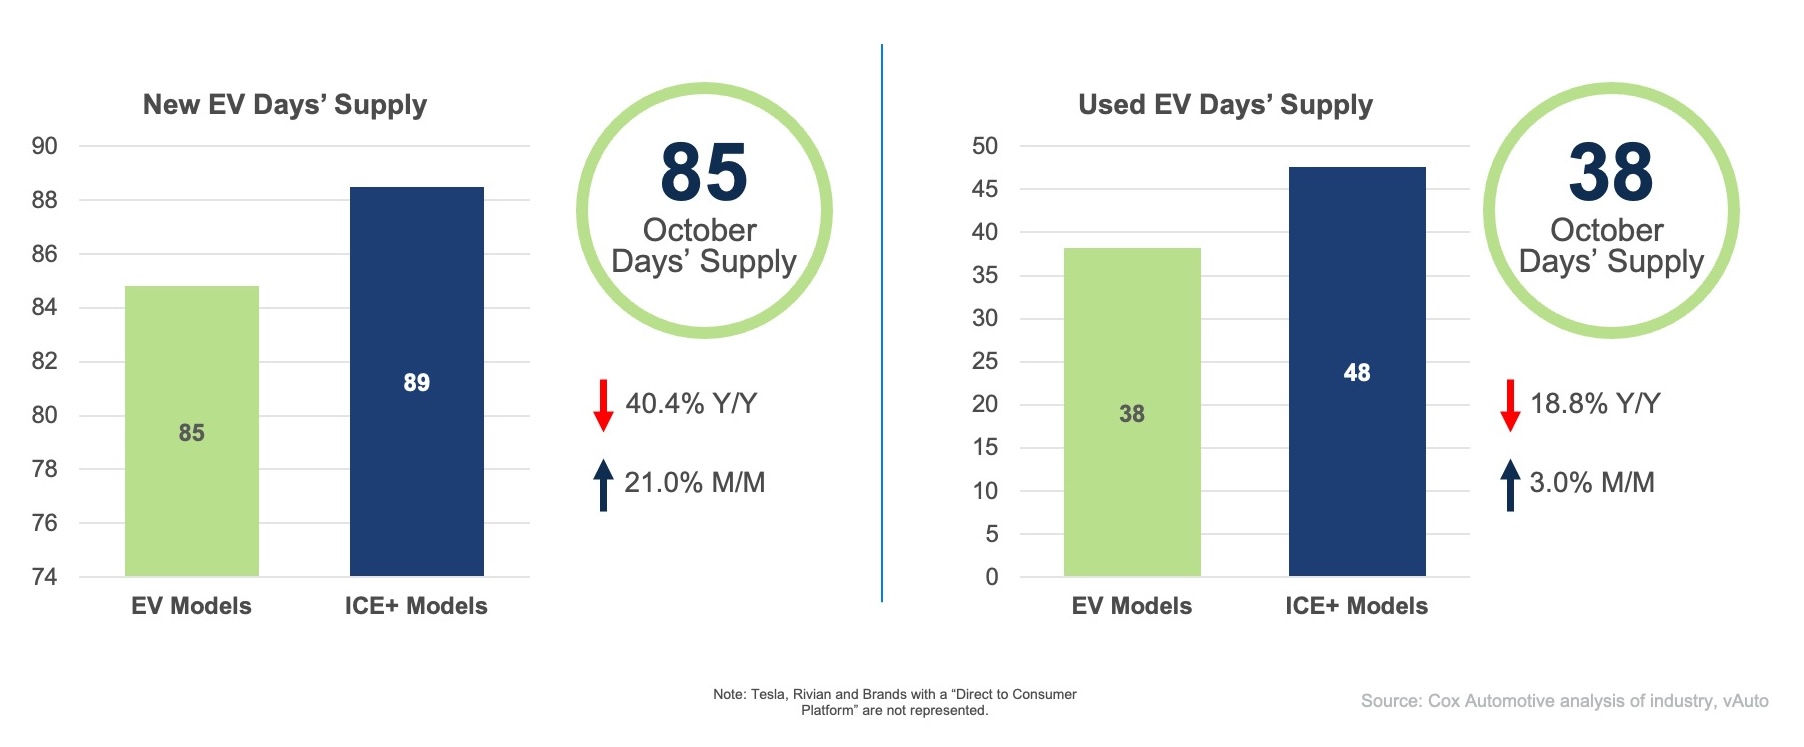
New EV Days’ Supply: New EV days’ supply rose to 85 days in October, down 40.4% year over year but up 21% month over month. By comparison, ICE+ supply was 89 days, down 0.9% from a year ago and up 7.9% month over month. New EV supply was about 4 days below ICE+ supply, narrowing from a 12-day gap in September. The October increase was driven primarily by slower sales rather than inventory growth. Estimated daily EV sales slowed by 15.2%, while inventory rose 2.7%.
Inventory levels remained uneven across brands. Honda had the leanest supply at 38 days, while Volkswagen had the highest supply at more than twice the industry average. Hyundai saw the largest month-over-month increase, while Nissan’s supply declined 24 days to 76 days.
Used EV Days’ Supply: Used EV days’ supply increased to 38 days in October, down 18.8% year over year but up 3% month over month. By comparison, ICE+ supply was 47 days, down 5.7% from a year ago and 4.9% month over month. Used EV supply was about 9 days below ICE+ supply, narrowing from roughly 12 days in September. Availability remained uneven across higher-volume makes. Tesla had the leanest supply at 32 days, while Mercedes-Benz declined 16 days month over month to 47 days. Audi recorded the largest increase among higher-volume makes, rising 6 days to 47 days, followed by Hyundai, up 5 days to 36 days.
Note: Tesla and Rivian figures reflect only vehicles available through traditional dealerships and exclude vehicles at factory-owned outlets.
New and Used EV Prices – October
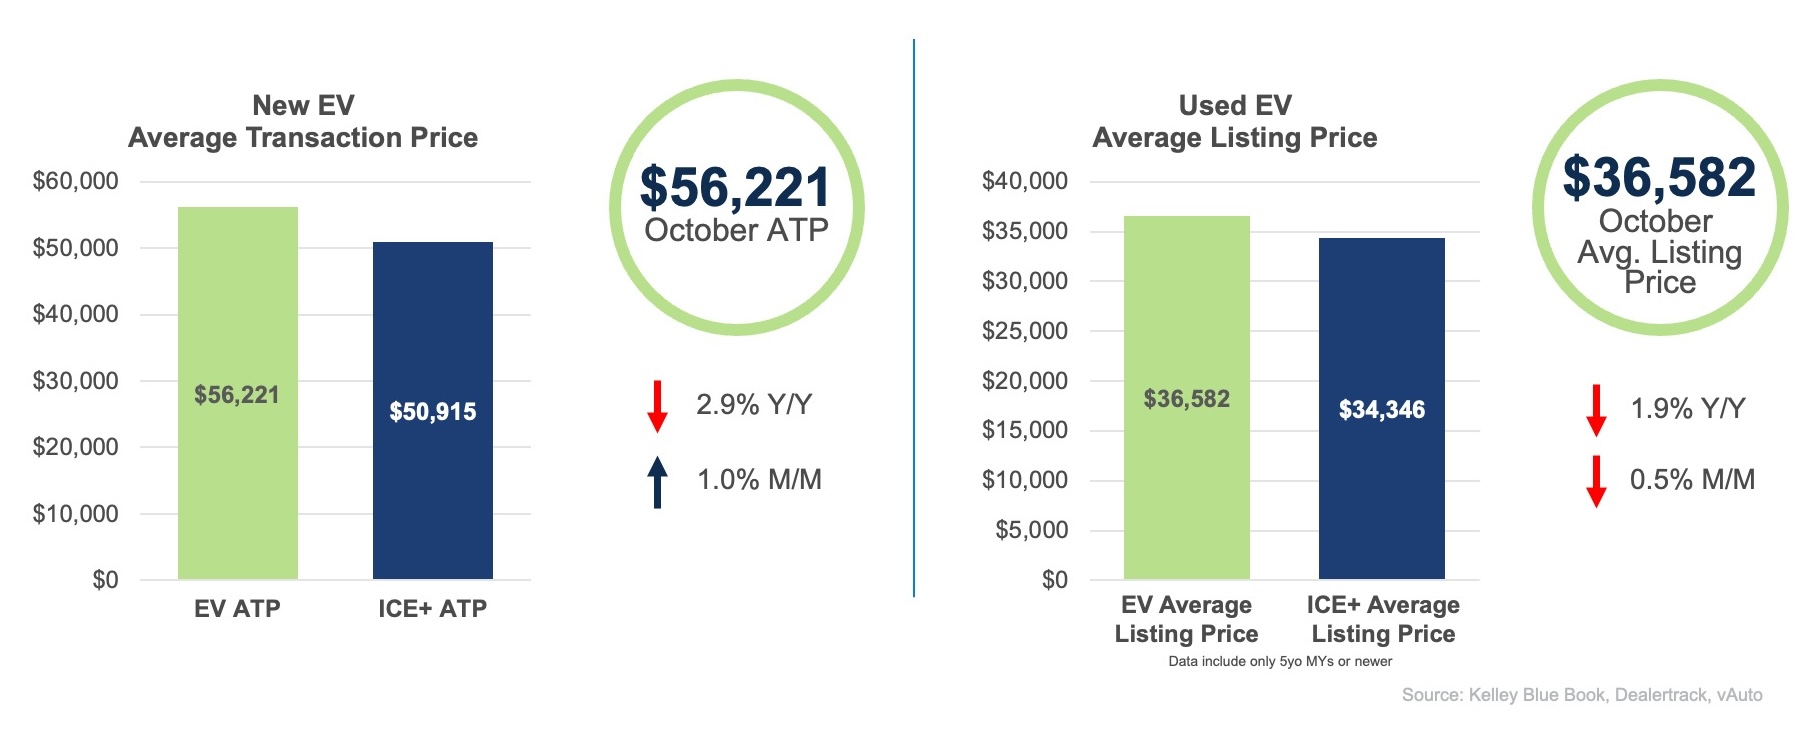
New EV ATP: The average transaction price (ATP) for a new EV was $56,221 in October, down 2.9% from a year ago but up 1% from September. The EV price premium over ICE+ vehicles narrowed slightly to $5,306 and was essentially in line with the 2026 average of $5,319. EV incentives averaged $6,375 per vehicle, or 11.3% of ATP, up from $5,949, or 10.3% of ATP, a year ago and $6,215 in September.
The increase in EV ATP reflected a richer mix of higher-priced vehicles. The Tesla Model Y, the market’s highest-volume EV, also helped push the EV ATP with an increase of 0.8% to $53,492. Model Y sales increased 9.4% from September. The Model Y gains more than offset lower prices and lower sales of the Tesla Model 3.
For more details, read the October Kelley Blue Book ATP report.
Used EV Listing Price: Used EV prices continued to ease in October, while sales remained strong. The average listing price for a used EV declined to $36,582, down 1.9% from a year ago and 0.5% from September. The premium over ICE+ vehicles widened slightly to $2,236, but at 6.5% remained relatively narrow. Despite a 1.8% increase in Tesla’s average listing price to $34,109, the overall used EV average declined amid lower prices for several high-volume models, including the Ford Mustang Mach-E, Nissan Ariya, Chevrolet Equinox EV and Volkswagen ID.4.
Looking Ahead
The electric vehicle market continues to adjust to the expiration of the federal tax credit, and October offered an early read on demand in a post-incentive market. New EV sales rose year over year for the first time in 2026, but EV share remained relatively steady and inventory rose, reinforcing the importance of affordability and incentives. Meanwhile, used EV sales continue to grow as more off-lease vehicles reach the market, creating more choices for shoppers, and prices stay close to those of ICE+ vehicles.
Heading into year-end, broader economic conditions, including inflation, fuel prices and consumer confidence, will shape how much shoppers are willing to spend. Whether the right mix of affordable EVs is available, and not just lower-priced models, will matter as much as incentives.
The EV Market Monitor gauges the health of the new and used electric vehicle (EV) markets by monitoring sales volume, days’ supply and average pricing. Each metric will be measured month over month and year over year.
Follow the link to view the entire series of EV Market Monitor reports.
For the official quarterly report on EV sales data, see the Q3 Electric Vehicle Sales Report.