
Wholesale used-vehicle prices (on a mix, mileage, and seasonally adjusted basis) decreased 3.0% in September from August. The Manheim Used Vehicle Value Index declined to 204.5 and is now down 0.1% from a year ago. The non-adjusted price change in September was a decline of 2.1% compared to August, moving the unadjusted average price down 2.3% year over year.
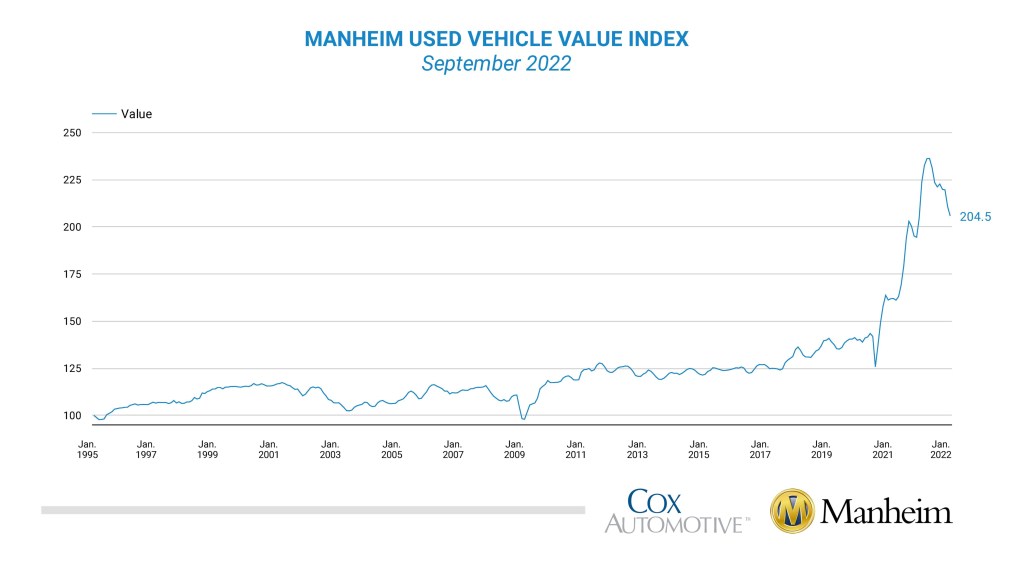
In September, Manheim Market Report (MMR) values saw larger-than-normal declines that were consistent over the month, culminating in a 2.5% total decline in the Three-Year-Old Index over the last four weeks. Over the month of September, daily MMR Retention, which is the average difference in price relative to current MMR, averaged 98.4%, meaning market prices were below MMR values. The average daily sales conversion rate decreased slightly to 49.2%, which was below normal for the time of year. For example, the sales conversion rate averaged 52.1% in September 2019. The lower conversion rate indicated that the month saw buyers with more bargaining power for the time of year.
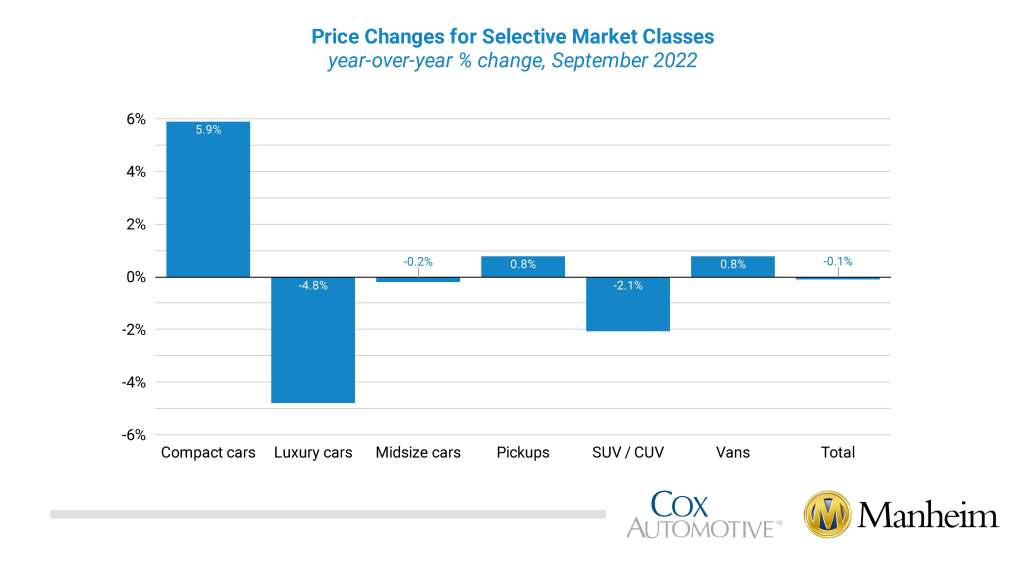
Only three of eight major market segments saw seasonally adjusted prices that were higher year over year in September. Compact cars had the largest increase, at 5.9%, followed by vans and pickups, both of which increased by 0.8%. The remaining five segments’ prices were well below the industry, with midsize cars only minimally lower. Compared to August, all eight major segments’ performances were down. Full-size cars lost more than 14%. Pickups and compact cars declined the least, at 1.4% and 2.6%, respectively. The remaining five segments (vans, SUVs, midsize, luxury, and sports cars) lost between 3.1% and 5.2%.
Used Retail Sales Declined in September
Leveraging a same-store set of dealerships selected to represent the country from Dealertrack, we estimate that used retail sales declined 8% in September from August and that used retail sales were down 10% year over year. Compared to September 2019, sales were down 18%, a slight improvement from August, when sales were down 19%, based on the same-store results.
Using estimates of used retail days’ supply based on vAuto data, September ended at 48 days of supply, down from 51 days at the end of August but higher than how September 2021 ended at 41 days. Leveraging Manheim sales and inventory data, wholesale supply is estimated to have ended September at 27 days, higher than how September 2021 ended at 19 days but down one day from the end of August.
September’s total new-light-vehicle sales were up 9.5% year over year, with the same number of selling days as September 2021. By volume, September new-vehicle sales were down 1.0% from August. The September SAAR came in at 13.5 million, a 9.6% increase from last year’s 12.3 million and up 2.9% from August’s 13.1 million pace.
Combined sales into large rental, commercial, and government fleets were up nearly 25% year over year in September. Sales into rental were up 18% year over year, while sales into commercial fleets were up 38% and sales into government fleets were down 2%. Including an estimate for fleet deliveries into dealer and manufacturer channels, the remaining retail sales were estimated to be up 8.2%, leading to an estimated retail SAAR of 11.8 million, up 0.3 million from last month’s pace, or 2.6%, and up 0.9 million from last year’s 10.9 million, or 8.5%. The fleet share of 12.3% was down 0.2% from August but up 1.1% from last September’s 11.2%.
Rental Risk Mileage Declined Again in September, Maintaining Stability
The average price for rental risk units sold at auction in September was up 0.6% year over year. Rental risk prices were down 2.9% compared to August. Average mileage for rental risk units in September (at 54,200 miles) was down 4.3% compared to a year ago and down 4.1% from August.
Measures of Consumer Confidence Mixed in September
The Conference Board Consumer Confidence Index® increased 4.2% in September. Both underlying measures of present situation and expectations saw gains, but expectations improved the most. Plans to purchase a vehicle in the next six months increased and were up year over year. The sentiment index from the University of Michigan also saw a slight gain in September. The Michigan index rose 0.7%, with only views of current conditions improving. Both the Conference Board and Michigan data sets do not include survey data representing the entire month, and sentiment weakened in the final days of the month. Morning Consult’s timelier daily Index of Consumer Sentiment declined in September with moves down in most of the last 14 days of the month. That index ended down 0.7% for the month, though it had been improving earlier in the month. Stock market declines and gas price increases likely influenced the more recent decline.
The complete suite of monthly MUVVI data for October will be released on Nov. 7, 2022, the fifth business day of the month as regularly scheduled
If you have any questions regarding the Index or would like to sign up for updates, please contact the Cox Automotive Industry Insights team at Manheim.Data@coxautoinc.com.


