Key Metrics
- The Manheim Used Vehicle Value Index (MUVVI) rose to 205.5, reflecting a 0.4% increase for wholesale used-vehicle prices (adjusted for mix, mileage, and seasonality) compared to December 2024. The December index is up 0.1% month over month. The long-term average monthly move for December is flat, showing no change from month to month.
- Non-adjusted wholesale vehicle prices are now up 0.5% year over year, although they declined 0.4% against November 2025. The long-term average monthly move in non-adjusted values is an increase of 0.3% in December.

Expert Perspective — Jeremy Robb, Interim Chief Economist, Cox Automotive
“Consumer spending trends showed signs of a slowdown in December, as affordability concerns caused many to pull back on the spending reins, translating to depreciation trends catching up a bit in wholesale markets over the month. As we moved into the holiday period, we saw seasonal patterns in used retail sales slowing down, while new retail sales increased against November trends but remained lower compared to 2024.
Consumer sentiment rose throughout December, but five consecutive weeks of lower year-over-year consumer spending kept the pace of sales in check. At Manheim, the year ended with days’ supply rising over the month, as is seasonally normal during the year-end holiday period. As we move into 2026, a few positive indicators are emerging: New and used auto loan rates have fallen to the lowest level in a year, and consumers will soon see increased tax refunds hit their wallets. As this plays out, we are expecting to see stronger demand in the auto market as the year gets underway.”
MMR Prices, Retention & Sales Conversion
- MMR prices for the Three-Year-Old Index declined 0.9% in December.
- MMR retention averaged 99.6% in December, up 60 basis points year over year, and up 0.7 percentage points from November.
- Sales conversion was 56.8% for the period, 4.6 percentage points higher than the most recent three-year average, and up 4.4 percentage points from November.
Takeaway: MMR prices for the Three-Year-Old Index declined a bit more than is typical for this period, as depreciation trends caught up a little to the long-term averages. MMR retention increased moderately and remains seasonally normal for this time of year. Meanwhile, sales conversion indicates a strengthening of demand, as the metric held higher than usual for this time of year.
Segment Performance: Year-Over-Year Price Changes
Overall market prices were up marginally from December 2024, led by the luxury segment and electric vehicles, while compact cars and pickups recorded the most significant declines.
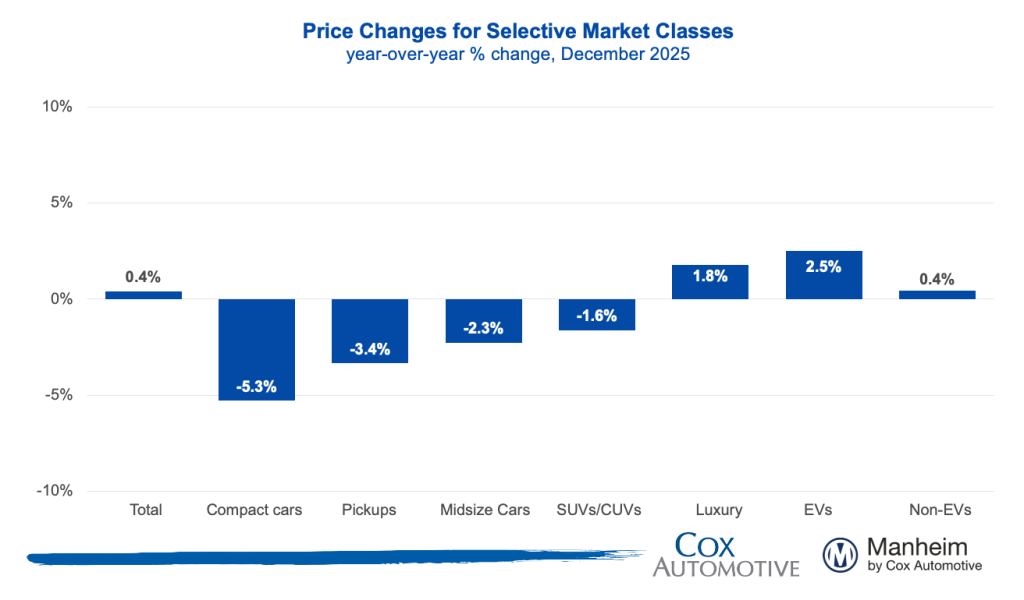
Takeaway: Most vehicle segments remain lower against year-earlier levels; however, we continue to see the luxury segment outperforming the overall market. We have observed the strength in this segment for several months, as it is more influenced by higher EV prices. Compact cars, midsize cars and pickups continue to see larger declines compared to 2024.
EV versus Non-EV Index
- EVs: The Electric Vehicle (EV) Index was up 2.5% year over year but down 0.1% from November.
- Non-EVs: The Non-EV Index was up 0.4% year over year and also higher by 0.1% from November.
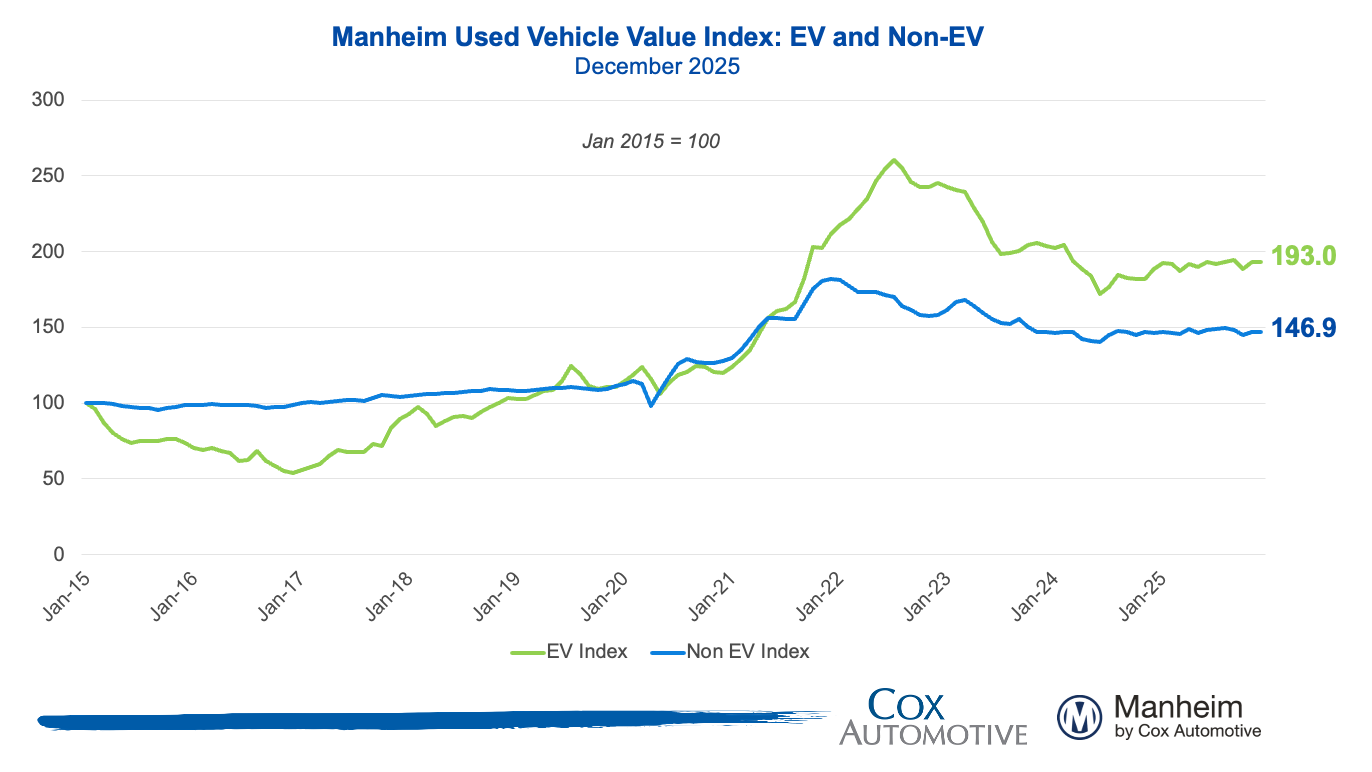
Takeaway: With the expiration of government-backed EV incentives, prices moderated, but remain higher than in 2024, when EV values saw much more depreciation in the first half of the year.
Wholesale Supply and Rental Prices
- Wholesale supply: At the end of December, wholesale days’ supply rose to 31.7 days, lower by 1.6 days year over year but higher by 1.1 days compared to November.
- Rental prices: Prices for rental vehicles are higher by 2.7% year over year as they increased in December, rising by 5.2% from November. Rental values on a non-seasonally adjusted basis are 2.9% above 2024’s level and rose 3.6% in December, driven by lower average mileage, which was down almost 15% against December 2024.
Takeaway: Before the pandemic, wholesale vehicle days’ supply averaged 36 days at the end of December, typically rising into year-end as the holiday calendar impacts the pace of sales. In 2025, wholesale supply rose at year-end, as is seasonally normal given the holiday period.
View historical MUVVI reports here.
For more information on the Manheim Used Vehicle Value Index, visit Manheim Insights.
View historical MUVVI reports here.
Register for the Q4 MUVVI call
on Thursday, Jan. 8, at 11 a.m. EST.
The Manheim Used Vehicle Value Index (MUVVI) is a trusted benchmark for tracking wholesale used-vehicle prices in the U.S., which helps dealers and analysts gauge market shifts and anticipate retail trends. The official measure is reported on the fifth business day of each month. The mid-month MUVVI number is a checkpoint number, is not an official reading and should not be compared to the official index reading. The mid-month is not a flash estimate, and it is not meant to provide any directional estimate of what the full month number will be. The next complete suite of monthly MUVVI data will be released on Thursday, Jan. 8, 2026. Register for the Q4 MUVVI call scheduled for that day at 11 a.m. EST.
For questions or to request data, please email manheim.data@coxautoinc.com. If you want updates about the Manheim Used Vehicle Value Index, as well as direct invitations to the quarterly call sent to you, please sign up for our Cox Automotive newsletter and select Manheim Used Vehicle Value Index quarterly calls.
Note: The Manheim Used Vehicle Value Index was adjusted to improve accuracy and consistency across the data set as of the January 2023 data release. The starting point for the MUVVI was adjusted from January 1995 to January 1997. The index was then recalculated with January 1997 = 100, whereas prior reports had 1995 as the baseline of 100. All monthly and yearly percent changes since January 2015 are identical. Learn more about the decision to rebase the index.