Key Metrics
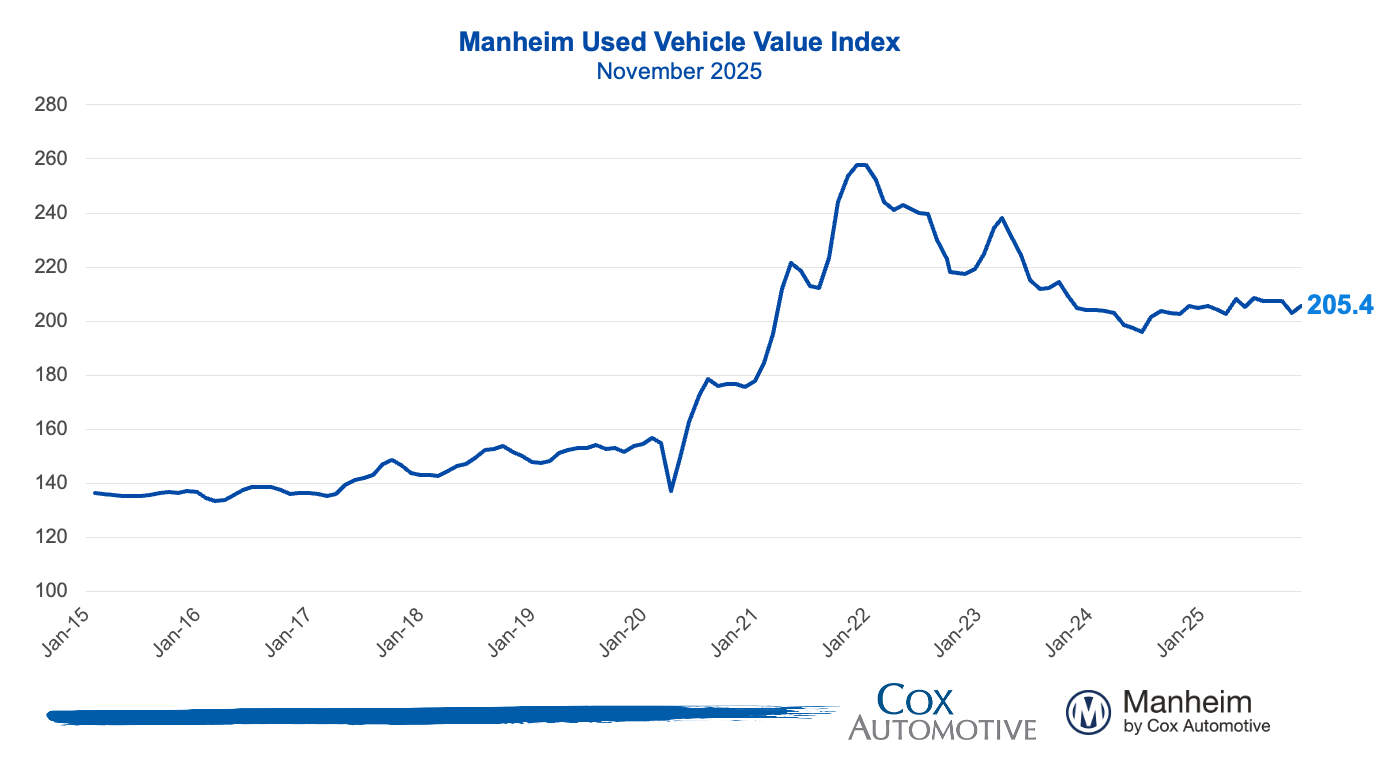
- The Manheim Used Vehicle Value Index (MUVVI) rose to 205.4, reflecting a 1.3% increase in November’s wholesale used-vehicle prices (adjusted for mix, mileage, and seasonality) compared to October. The index is mostly unchanged compared to November 2024. The long-term average monthly move for November is a decrease of 0.6%.
- Non-adjusted wholesale vehicle prices fell 0.3% from October and are now flat year over year, giving back some of the strength observed throughout most of this year. The long-term average monthly move in non-adjusted values is a decline of 0.4% in November.
Expert Perspective — Jeremy Robb, Interim Chief Economist, Cox Automotive
“Like most metrics we track across the automotive landscape, wholesale prices dipped in October before showing modest improvement in November.
“As November progressed, both new and used retail sales lifted from October levels, and the longest government shutdown in history came to an end. While consumer sentiment remains subdued, early reads suggest confidence is recovering. We’re seeing good vehicle sales supported by lower APR rates, and price depreciation is trending back to normal, with values slightly higher than usual. We’re also only a month from January, when lower tax withholding rates will boost take-home pay. Once consumers feel that in their paychecks and realize their tax refunds could be substantially higher this year, we are expecting some tailwinds to hit the auto market.”
MMR Prices, Retention & Sales Conversion
- MMR prices for the Three-Year-Old Index declined 1.9% in November.
- MMR retention averaged 98.9% in November, down 0.1 percentage points from October and 50 basis points year over year.
- Sales conversion was 57.2% for the period, up 2.9 percentage points from October and 5.2 percentage points higher than the most recent three-year average.
Takeaway: MMR prices declined slightly more than the typical 1.7% for this period, but the trend eased as the month progressed. Although MMR retention decreased somewhat, it remains generally in line with expectations for this time of year. Meanwhile, sales conversion indicates a modest strengthening of demand, with conversions higher than usual for this time of year.
Segment Performance: Year-Over-Year Price Changes
Overall market prices were flat from a year ago, with luxury vehicles experiencing the highest increase and compact cars recording the most significant decline.
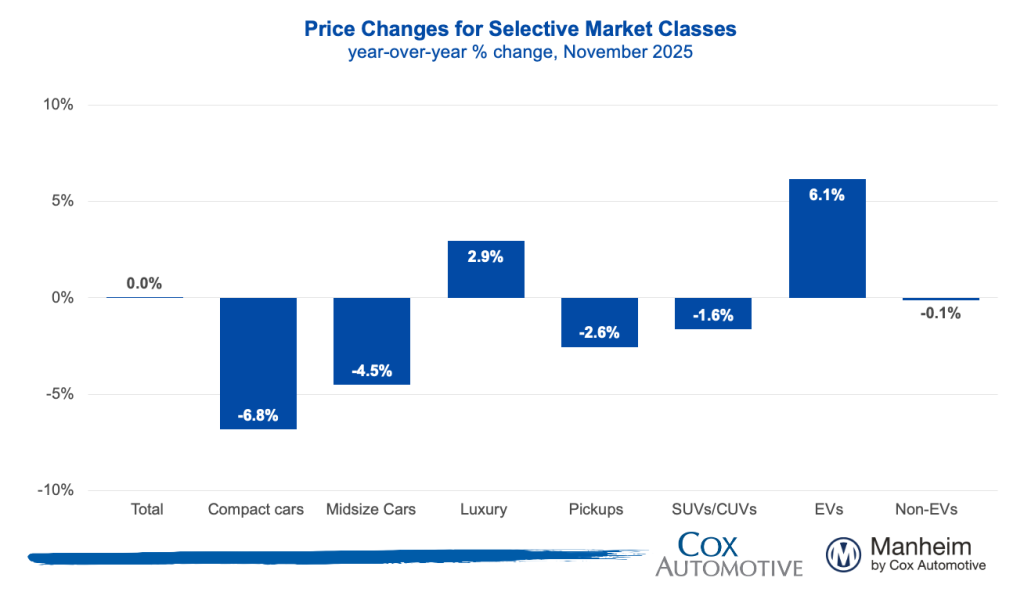
Takeaway: Most vehicle segments remain lower against last year; however, we continue to see the luxury segment outperforming the overall market. We have observed the strength in this segment for several months, as it is more influenced by higher EV prices. Compact and midsize cars continue to see large declines compared to last year.
EV versus Non-EV Index
- EVs: The Electric Vehicle (EV) Index was up 2.3% from October (post EV tax credit expiration), and up 6.1% year over year.
- Non-EVs: The Non-EV Index was up 1.3% from October and down 0.1% year over year.
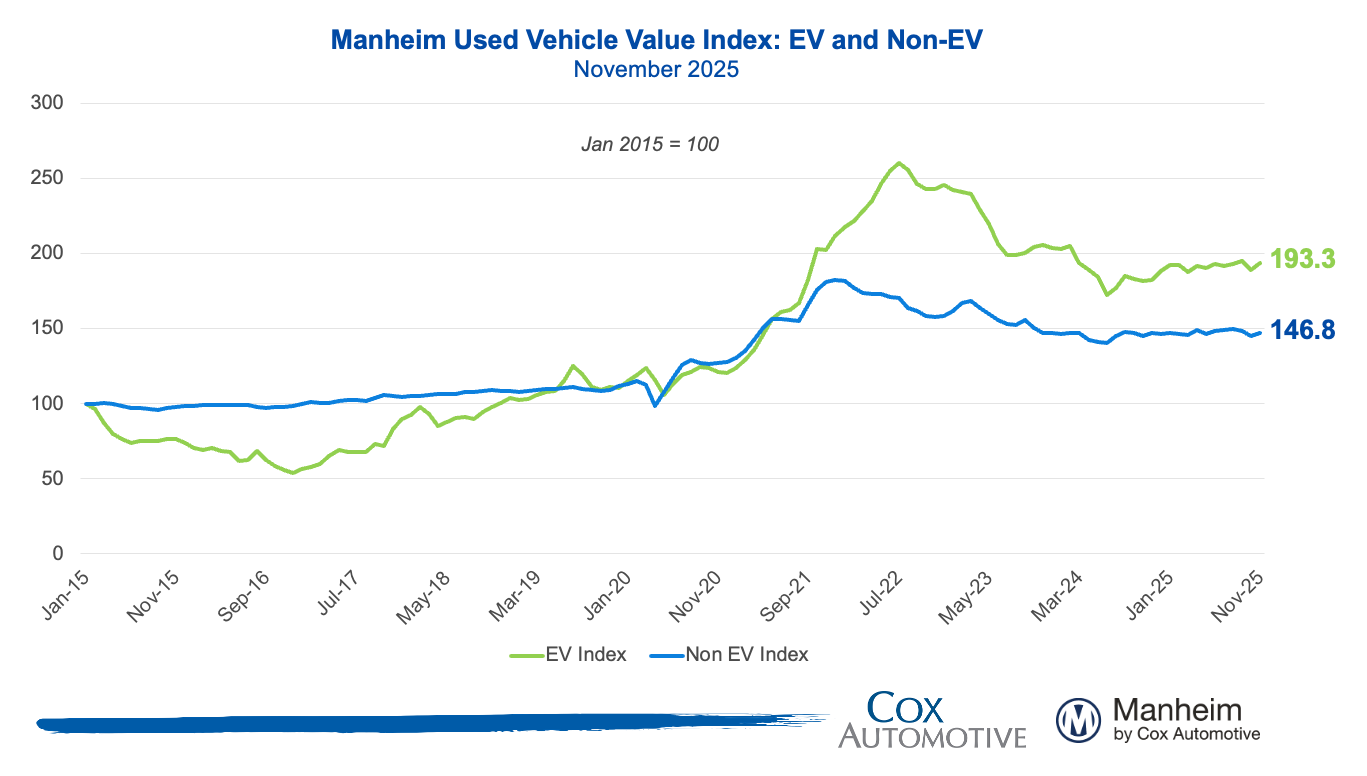
Takeaway: With the expiration of government-backed EV incentives, pricing dynamics shifted in the market. Essentially, the retail price of many new and used EVs went up when the incentives and the “leasing loophole” were removed, forcing dealers to pursue lower prices to maintain demand.
Wholesale Supply & Rental Prices
- Wholesale supply: At the end of November, wholesale days’ supply rose to 30.1 days, higher by 2.2 days compared to October, and higher by 1.3 days year over year
- Rental prices: Prices for rental vehicles declined in November, falling by 4.3% from October. Non-seasonally adjusted values for Rental units are down 3.3% year over year, while average mileage is down 9.1% against the same period.
Takeaway: Before the pandemic, wholesale used vehicle supply averaged 32 days at the end of November, typically rising into year-end as seasonal factors play out. This year, wholesale supply rose over the course of the month as is usual, as holiday periods slow the pace of sales.
View historical MUVVI reports here.
For more information on Manheim, visit Manheim.com.
The Manheim Used Vehicle Value Index (MUVVI) is a trusted benchmark for tracking wholesale used-vehicle prices in the U.S., which helps dealers and analysts gauge market shifts and anticipate retail trends. The official measure is reported on the fifth business day of each month. The mid-month MUVVI number is a checkpoint number, is not an official reading and should not be compared to the official index reading. The mid-month is not a flash estimate, and it is not meant to provide any directional estimate of what the full month number will be. The next complete suite of monthly MUVVI data will be released on Jan. 8, 2026.
For questions or to request data, please email manheim.data@coxautoinc.com. If you want updates about the Manheim Used Vehicle Value Index, as well as direct invitations to the quarterly call sent to you, please sign up for our Cox Automotive newsletter and select Manheim Used Vehicle Value Index quarterly calls.
Note: The Manheim Used Vehicle Value Index was adjusted to improve accuracy and consistency across the data set as of the January 2023 data release. The starting point for the MUVVI was adjusted from January 1995 to January 1997. The index was then recalculated with January 1997 = 100, whereas prior reports had 1995 as the baseline of 100. All monthly and yearly percent changes since January 2015 are identical. Learn more about the decision to rebase the index.