
In this issue of the Auto Market Weekly Summary, we have a lot of economic updates to share, as well as some key themes and trends gleaned from the publicly traded automotive companies over the last couple of weeks.
Bottom Line Up Front
Markets were rattled last week after the Federal Reserve held interest rates steady on Wednesday, as expected. A day later, a host of new data showed inflation trends continuing to accelerate, including the Fed’s preferred inflation gauge: The Personal Consumption Expenditures (PCE) Price Index rose 3.6% from a year ago. At the same time, Q3 GDP accelerated to 3.4%, with consumer spending staying strong and AI investment continuing to push growth higher. Without the drag from imports and exports, growth would have been even stronger, and that likely would have put even more pressure on inflation trends across the economy. All of these points argue for higher interest rates, yet only two voting members of the Federal Open Market Committee dissented in favor of a hike at the October meeting.
Against that backdrop, the market has grown more worried about both the pace of AI investment and measuring the return on all that spending to date. These worries weighed on equities this week and are increasingly important for an economy dependent on a strong wealth effect. This week brings the midterm elections, with the House expected to change hands and a greater chance the Senate moves to Democratic control as well. We should know the results soon, but positioning ahead of the expected election-driven outcomes could be another factor behind last week’s moves.
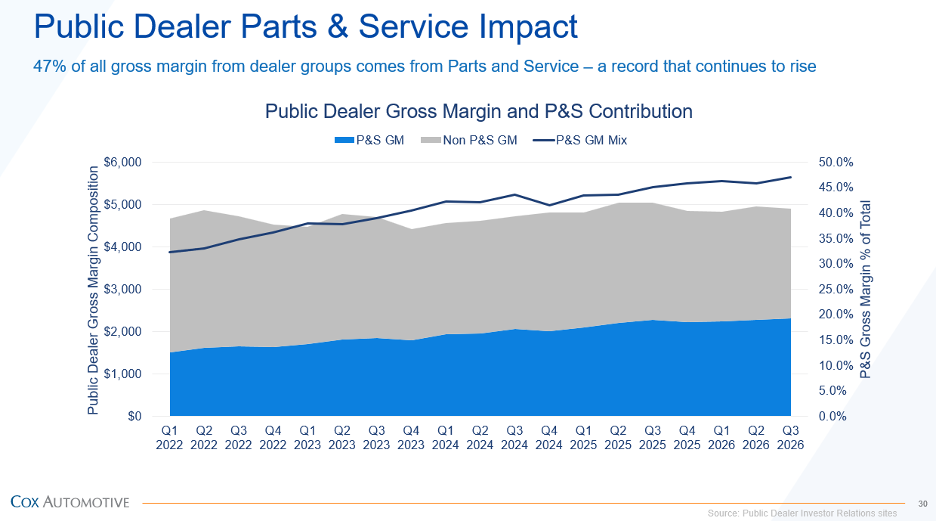
For vehicle retailers, Q3 earnings from the publicly traded dealer groups came in over the last two weeks. Most are still being squeezed on front-end gross while leaning on parts and service for sales and profit. That theme has been front and center all year, and it continues to hold sway across dealer groups. With the oldest car parc in history and upper-middle-class consumers consistently trading down into the used market, the service lane should be a primary focus for many dealers over the next several years. Dealers should keep serving those customers and growing their share, because this is a part of the market where the overall pie can grow, given the average age of vehicles on the road and demographic trends. For now, the wealth effect and an aging car parc are doing the heavy lifting, while a consumer whose income can’t keep pace with expenses keeps stretching to make it work.
One factor impacting the vehicle market is the cost of money becoming a much larger part of the equation, with interest on a typical new-vehicle purchase up 79% since 2019 to $10.1K and up 96% to $10.9K for a used vehicle over the life of the loan. In fact, due to higher financing costs, the average used-vehicle down payments have dropped to nearly 0% of a typical loan. This has helped push the all-in cost higher by 37% for new and 43% for used versus 2019, outpacing the roughly 30% rise in vehicle price alone.
Automotive Public Dealer Group Q3 Results
Publicly traded dealer groups have been reporting Q3 earnings over the last two weeks, and they continue to lean on parts and service for profits. New gross profit per unit was down against Q2 and last year, while used GPUs declined against last quarter but are up almost 5% against Q3 of 2025.
Used GPUs fell in aggregate by almost 2% against last quarter, with only Sonic Franchise and Carvana showing growth. The combined weighted average used GPU of $2,392 is up 4.7% against the same period last year. All used dealers showed higher GPU year over year except Sonic and CarMax.
- Parts and service impact on profitability continues to grow. Total parts and service revenue rose quarter over quarter to almost $4.3B, while gross profit from parts and service increased to $2.3B, higher by 1.3% quarter over quarter and 1.5% year over year.
- In aggregate, over half or 54% of all gross profit reported by publicly traded dealer groups now comes from parts and service.
- Aggregating results from the public’s reporting, total revenue at about $30.8 billion in Q3 was higher by 1.1% quarter over quarter but lower by 1.6% year over year.
- Both operating income and gross profit were lower on a quarter-over-quarter and year-over-year basis. Gross margin fell to 16.0% of revenue overall, down 10 basis points year over year. Operating margin for the group declined to 3.8% of revenue, down 70 basis points from 4.5% last year.
- Sales-weighted new gross per unit (GPU) declined 4.6% quarter over quarter to $2,703, down 6% from $2,876 last year as dealers continue to feel the pinch on the new car side.
Q3 GDP Growth
GDP growth, the broadest measure of economic activity, accelerated further in Q3, rising to an annual run rate of 3.4%, up from 2.2% in Q2. This is the advance estimate and is subject to revisions. However, the broad measure of the economy shows that consumer spending remains robust and AI investment has continued to be an important driver of growth.
- Advance readings for Q3 GDP growth showed the economy expanded at a 3.4% annualized pace, up from 2.2% in Q2 and 2.5% in Q1. The consumer expenditure category grew by 2.5%, relatively flat against Q2 levels, while investment rose by almost 1.7% annualized.
- GDP growth would have been even higher if net exports were not an almost 1 percentage point drag on total economic activity. In Q3, imports accelerated by almost a full point while exports declined, led by lower exports of goods.
- Real final sales to private domestic purchasers, which excludes the volatility of government, changes in business inventories, and net exports, accelerated sharply in Q3. The metric rose to an annualized growth rate of 4.9%, up from 4.6% in Q2 and the highest since Q2 of 2021.
Personal Income and Spending
Income growth for consumers lagged expense growth, adding to a growing gap in how they fund monthly purchases. This comes as PCE price gains reaccelerated in the month, while the savings rate fell to the lowest levels in roughly four years.
- Personal income rose 0.2% month over month in September, a step down from 0.3% in August, and now 4.1% higher year over year. Personal expenses rose 0.5%, slower than the 0.9% month over month change in the prior month, but higher than income grew. Expenses are up 6.3% year over year.
- The PCE price index accelerated and rose by 0.5% month over month in September, up from 0.3% in August. year over year, the PCE price index is up 3.6%. Core PCE (excluding food and energy) rose 0.3% month over month, the same increase seen in August, and is up 3.1% year over year.
- Real consumer spending showed no change in September, after rising every month since January.
- As spending outpaced income, the personal saving rate fell to 3.8% from a revised 4% in August, versus 5.1% a year ago.
Consumer Confidence
Consumer confidence rebounded in October, following three months of deterioration as views of both current conditions and the outlook improved alongside slightly easing gas prices. The gain only partly reversed the summer’s declines, and expectations remain at levels that have historically pointed to risk of recession.
- The Conference Board Consumer Confidence Index rose 7.5 points to 91.7, up from a revised 84.2 in September and well above expectations.
- The Present Situation Index climbed 8.6 points to 120.4, while the Expectations Index rose 6.9 points to 72.6. However, it has now stayed below the 80 recession-signal threshold for 21 straight months.
- The labor market differential (jobs “plentiful” minus “hard to get”) improved 2.4 points to +5.3, and average 12-month inflation expectations eased to 5.8% from 6.0%.
- Plans to buy an auto softened to 11.1%.