
Interest-rate expectations shifted quickly last week, adding to auto borrowing costs that were already climbing. In this issue of the Auto Market Weekly Summary, we look at what a more aggressive Federal Reserve path could mean for vehicle financing, along with updates on October consumer and producer prices, auto credit availability and the New York Fed’s quarterly report on household debt and credit.
Bottom Line Up Front
Markets moved quickly last week to price in a more aggressive Fed. A week earlier, futures markets saw a single quarter-point hike as the most likely outcome for the January meeting, with better than a 1-in-4 chance of no move at all. As of Friday morning, Nov. 13, the odds of no hike had fallen to zero, and the market was putting nearly 70% odds on a second quarter-point hike by January. A stronger-than-expected October jobs report, followed by a hotter-than-expected Consumer Price Index (CPI) reading with core prices up 0.3% for a third straight month, did much of that work. Friday’s producer price report did little to ease those concerns. Wholesale prices rose a more modest 0.3% in October, but the 12-month pace climbed to 6.5%, the fastest since late 2022, and core producer prices rose 0.5% for a second straight month.
Longer-term rates were volatile last week, adding to concerns for markets and the outlook for large consumer purchases. The 10-year Treasury yield was 4.98% as of Tuesday, Nov. 10, down from above 5.2% a month earlier, then climbed back to 5.13% as of Friday. The week’s inflation readings heightened those worries, and news of Nvidia’s leadership change added to uncertainty among market participants.
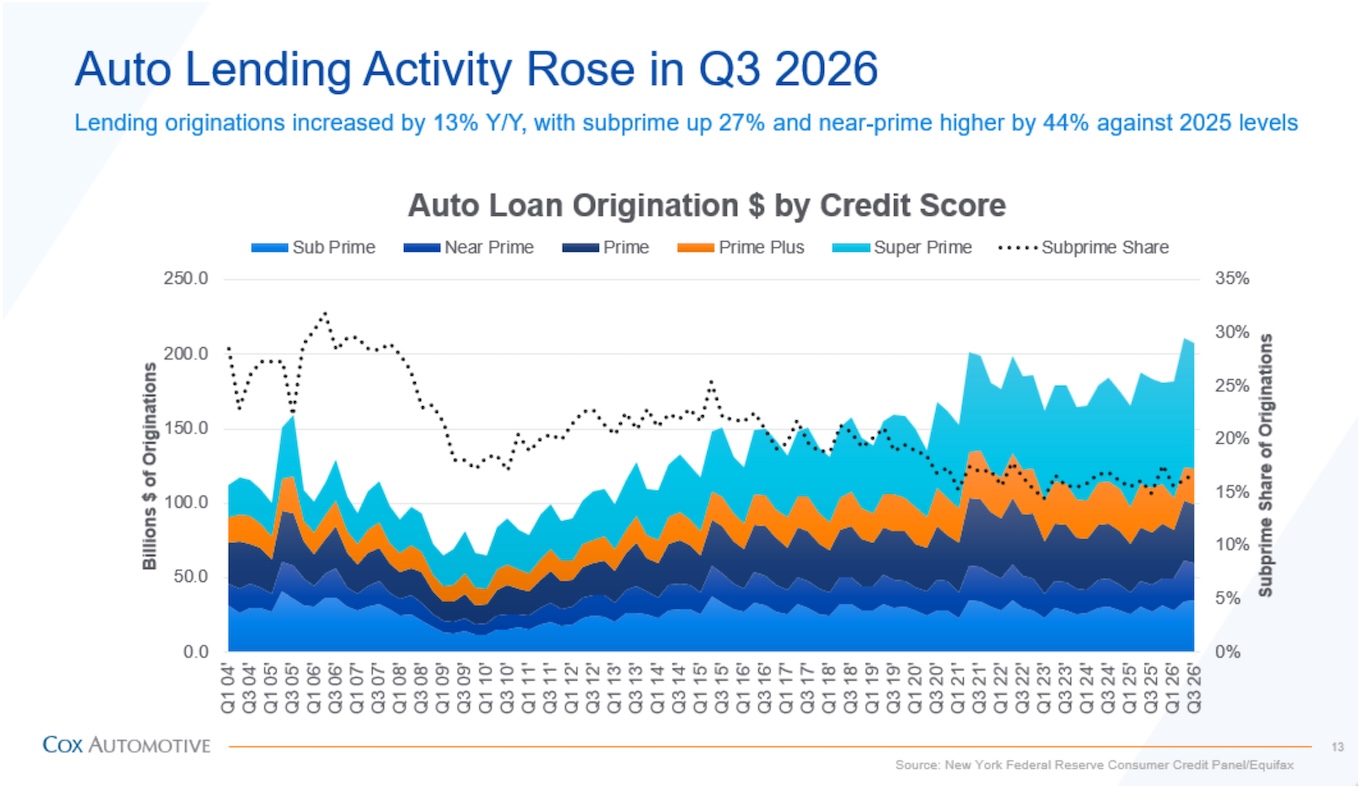
We are already seeing higher consumer rates in auto finance. Average rates on new-vehicle loans hit about 10.5% in October, the highest in our data going back to 2019, and partial-month data suggest November is running higher still. Used-vehicle loan rates are approaching 15%. At the same time, the New York Fed’s latest report shows households are still borrowing: Auto loan balances rose $21 billion in the third quarter to $1.73 trillion, and auto loan originations stayed strong at $208 billion. Serious auto delinquency was little changed from a year ago, a sign that most borrowers are keeping up even as early-stage delinquency creeps higher.
So far in November, we’ve continued to see fairly stable demand for both new- and used-vehicle sales, supported by credit access at its best level in more than a decade and gas prices now just under $4 a gallon. But if the Fed follows through on what markets now expect, financing costs will become a bigger headwind for affordability heading into 2027, especially for the near-prime and subprime buyers who have made up a substantial share of approvals.
Consumer Price Inflation
October new-vehicle sales came in well below expectations, as a pullback among retail buyers offset another solid month for fleet. Softer tech-led equity markets, affordability and election uncertainty may have kept some shoppers on the sidelines, though the year-to-date pace remains on track for a full-year finish near 16 million.
Consumer prices rose faster than expected in October, and the gains spread well beyond energy. According to the Bureau of Labor Statistics (BLS), the CPI rose 0.4% month over month after a 0.6% gain in September, while core prices rose 0.3% for a third straight month. The BLS did not publish 12-month rates for most series because October 2025 data were never collected during the 2025 government shutdown.
- Headline CPI rose 0.4% month over month, above expectations. Shelter rose 0.3% and accounted for more than 30% of the monthly increase, food rose 0.5% and energy rose 0.7% after a 5.2% jump in September.
- Core CPI, which excludes food and energy, rose 0.3% month over month, also above expectations. Recreation (+0.8%), medical care (+0.3%) and motor vehicle insurance (+0.7%) were among the categories that increased.
- Used car and truck prices fell 1.2% month over month and were down 3.3% year over year, while new-vehicle prices rose 0.2% month over month and were up 0.7% year over year. Our estimate of used-vehicle price changes, matching the BLS methodology as closely as possible, suggests prices are 3.7% higher year over year.
- In auto, maintenance and repair costs continue to rise faster than overall inflation, up 6.1% year over year, while parts and equipment are up only 1.5% over the same period. Public transportation costs are estimated to be almost 21% higher than last year, driven by the high cost of airfare.
Producer Prices
Producer price growth slowed in October after September’s jump, but the 12-month pace kept climbing, according to the BLS. Goods led the way, while services rose more modestly on a jump in truck freight prices.
- The Producer Price Index (PPI) for final demand rose 0.3% month over month in October following a 1.4% gain in September. Year over year, prices rose 6.5%, the largest 12-month increase since November 2022.
- Goods prices rose 0.5% month over month as food climbed 1.3% and energy slipped 0.1%. Goods prices are up 10.2% year over year, the most since October 2022.
- Services prices rose 0.2% month over month, a fifth straight gain, led by a 3.9% jump in truck freight prices.
- Core PPI, excluding food, energy and trade services, rose 0.5% month over month for a second straight month and 4.9% year over year.
Credit Availability
Auto credit access improved for a sixth consecutive month in October, but only slightly, and the components were split. The Dealertrack Credit Availability Index rose 0.1% to 107.1, its highest level since April 2015, and was 8.9% higher than in October 2025. A higher subprime share was the largest contributor, while a lower share of long-term loans and a wider yield spread were the biggest drags.
- The approval rate rose 20 basis points to 73.9%, largely reflecting the exit of a near-prime lender whose low approval rate had weighed on the average. The subprime share rose 50 basis points to 17.9%, a third straight increase.
- The yield spread widened 11 basis points to 6.53% as the average contract rate rose 24 basis points to 11.46%, its highest since March 2026, outpacing a 13-basis-point rise in the five-year Treasury yield.
- The share of loans with negative equity rose 90 basis points to 58.7%, the highest since March. The share of loans longer than 72 months fell 70 basis points from its record high to 31.1%, and down payments rose to 13%.
Household Debt and Credit
Household debt grew in the third quarter, led by mortgages and home equity lines of credit, according to the Federal Reserve Bank of New York. Delinquency edged higher, and early-stage auto loan delinquency kept creeping up, but serious auto delinquency held about where it was a year ago.
- Total household debt rose $334 billion, or 1.8%, in the third quarter to $19.105 trillion, up $520 billion year over year. Mortgage balances rose $257 billion to $13.374 trillion, though about half of that gain reflected balances re-reported after a reporting gap in the second quarter.
- Home equity line of credit balances rose $23 billion to $481 billion, the largest quarterly increase since 2005 and the 18th straight quarterly gain.
- Auto loan balances rose $21 billion, or 1.2%, to $1.73 trillion, and $208 billion in newly originated auto loans appeared on credit reports during the quarter. The annualized share of auto balances moving into serious delinquency (90 or more days) was 3.02%, little changed from 2.99% a year earlier. Origination growth was led by near-prime loans, up 44% year over year, while subprime originations increased 27% over the same period. Total auto loan originations increased 13% year over year in the third quarter.
- In all, 5% of outstanding debt was in some stage of delinquency, up 0.3 percentage points from the second quarter. Credit card balances rose $22 billion to $1.29 trillion, while the flow of card balances into serious delinquency eased to 6.87% from 7.05% a year earlier.