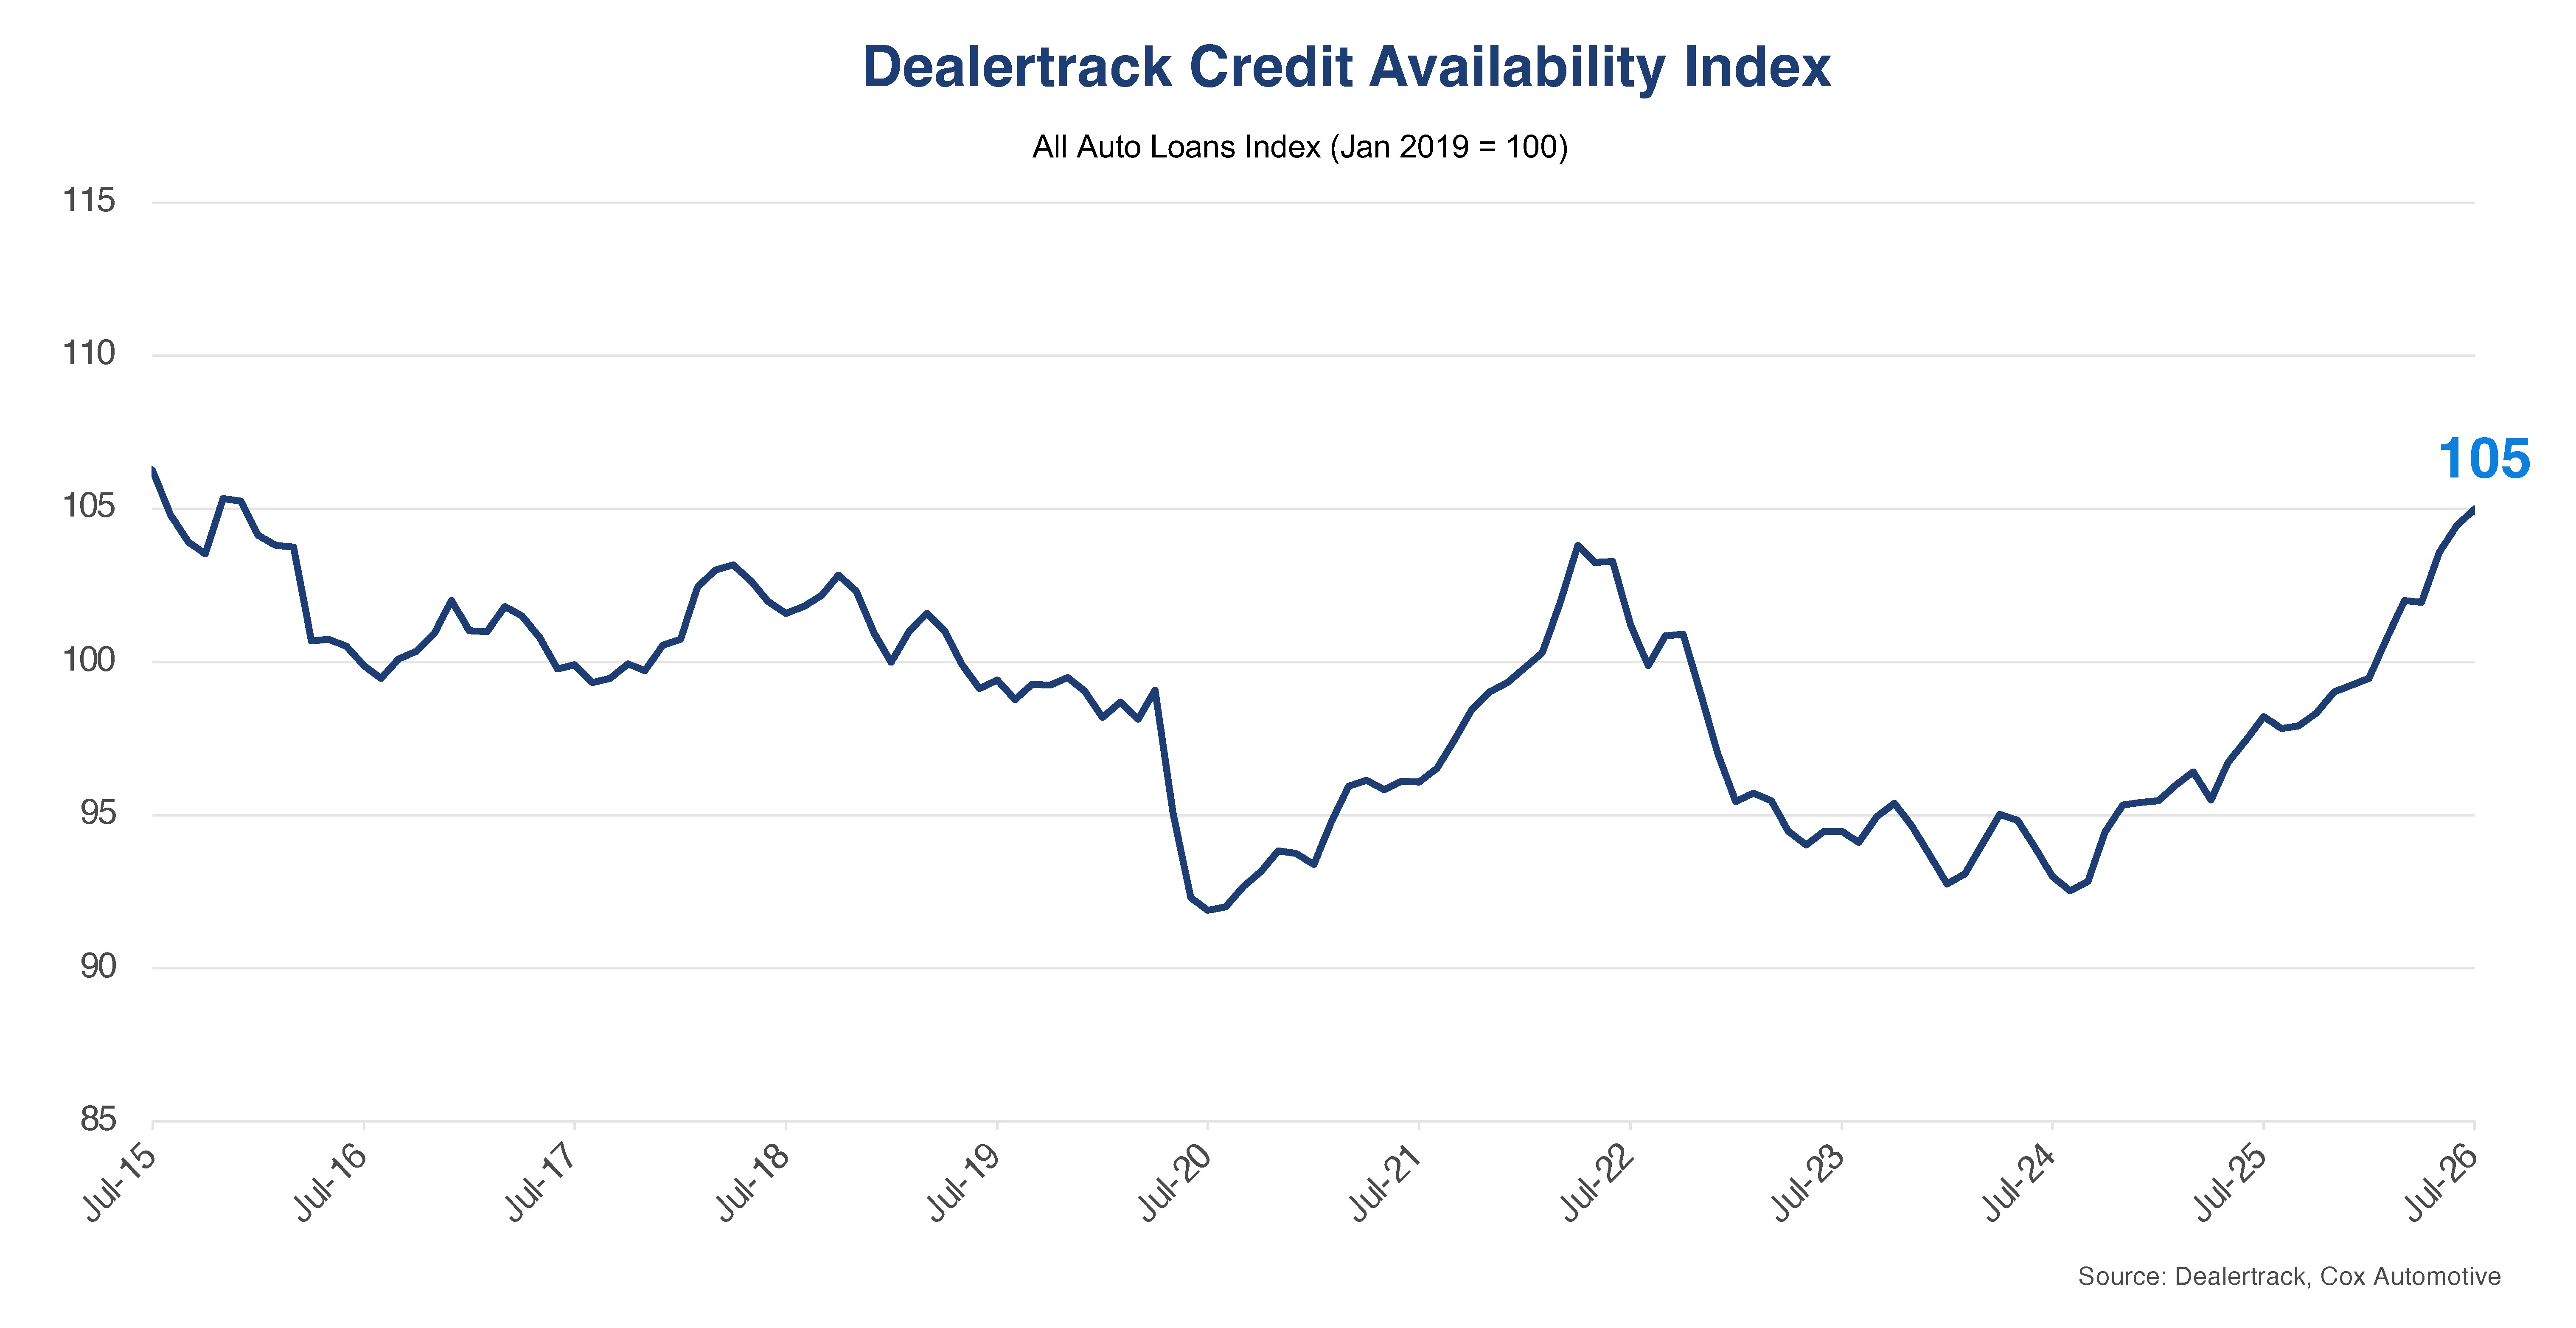
In July 2026, the Dealertrack Credit Availability Index rose to 105, the highest level since November 2015. The All-Loans Index increased 0.5% from June’s 104.5 and is up 7% from July 2025.
The monthly gain was driven primarily by a narrowing yield spread and a further improvement in approval rates. A continued pullback in subprime share was the primary offset to those gains.
Key Metrics
- Approval Rates: The overall loan approval rate rose to 74% in July, up 37 basis points (bps) from June, its fourth consecutive monthly increase and its highest level since August 2025. Year over year, the rate is unchanged. Approval rates were the second-largest contributor to July’s index gain.
- Subprime Share: The share of loans to subprime borrowers declined 21 bps month over month, to 16.4%, the fourth consecutive monthly decline following March’s surge to 19.5%. Despite four months of pullback, subprime share remains up 267 bps year over year, reflecting conditions that are still more positive for higher-risk borrowers than a year ago. The continued decline was the primary drag on July’s index.
- Yield Spread: The yield spread narrowed 20 bps (from 6.77% to 6.57%), its narrowest reading since January 2025 and 59 bps below the 7.2% it has averaged since the start of 2023. The average contract rate fell 8 bps to 10.90% while the 5-year Treasury yield rose 12 bps to 4.33%, narrowing the spread from both directions. Year over year, the spread is down 32 bps from 6.89% in July 2025. The narrowing was the single largest contributor to July’s index gain.
- Loan Term Length: The share of loans with terms greater than 72 months held at 31.1% in July, unchanged from June and a second consecutive month at the all-time high in the dataset, as lenders and consumers continue to stretch loan length to make deals work. Year over year, the share is up 484 bps from 26.3% in July 2025.
- Negative Equity Share: The share of loans with negative equity declined 23 bps, to 56.8%, the fourth consecutive monthly decline following March’s record high of 59.2%. Despite four months of easing, negative equity remains up 269 bps year over year and above any monthly reading recorded between 2015 and 2019.
- Down Payment Percentage: Down payments declined 22 bps to 13%, the second consecutive monthly decline and the lowest level since October 2022. After holding steady near 13.5% since July 2025, the share has moved lower in each of the past two months, leaving it 51 bps below that year-ago level.
Channel and Lender Trends
- Channels: Credit access improved unevenly by channel in July. Independent Used posted the largest monthly gain, up 0.8%, followed by All Used, up 0.5%. Franchised Used rose 0.3% and All New rose 0.2%. Certified pre-owned declined 0.2% and Non-Captive New declined 0.3%, the only two channels to lose ground.
- Lender Types: Three of the four lender types posted gains in July. Credit Unions rose 1%, the largest monthly gain, followed by Captives, up 0.8%, and Finance Companies, up 0.3%. Banks were the exception, declining 0.9%.
Year-Over-Year Comparison
- Channels: Independent Used and All New posted the largest year-over-year gains, each up about 8%, followed by All Used and Franchised Used, both up about 7%, and Non-Captive New, up a little over 6%. Certified pre-owned posted the smallest year-over-year gain, up 1.5%. All channels remain meaningfully above year-ago levels, with Independent Used and All New leading year-over-year gains.
- Lender Types: Captives led year-over-year improvement, up 12.5%, followed by Banks, up 11.9%. Credit Unions improved 8.8% and Finance Companies improved 7.2% year over year. All four lender types remain well above year-ago levels, with Captives and Banks continuing to lead year-over-year improvement.
Implications for Consumers and Lenders
- Consumers: Conditions for financing a vehicle were more favorable in July, though the improvement was not evenly distributed. Approvals rose for a fourth straight month, improving across all four lender types and every used channel, with New the lone exception. Rate relief was narrower: The average contract rate fell 8 bps to 10.9% even as the 5-year Treasury rose, leaving borrowers in aggregate paying less over the benchmark than at any point since January 2025, though that decline came almost entirely from captive lenders, which cut 25 bps, while banks, credit unions and finance companies all edged higher.
- The terms doing much of that work, though, push cost outward. A record share of loans ran past 72 months, down payments fell to their lowest share since October 2022, and a majority of loans were written for more than the vehicle was worth. Each of those makes a purchase manageable month to month while raising total loan cost and risk exposure over the life of the loan, extending the period during which a borrower owes more than the vehicle is worth.
- Lenders: The index reached its highest level since December 2015, though the gain was smaller than June’s and narrower across lender types. The loosening came through structure more than pricing or credit quality. Most of the spread’s narrowing came from the Treasury’s move rather than from lender pricing, and the 8 bps decline in the average contract rate was concentrated in Captives.
- Approvals are only back to year-ago levels, so the willingness to lend is holding rather than expanding, and the subprime share of booked loans fell for a fourth straight month, shifting the mix toward better credit even as subprime application volume rose. Both cost lenders yield, one on the spread and one on the mix. What runs the other way is duration and the share of value financed, with a record share of the book extending past 72 months and a smaller share of price covered by cash at signing. Longer loans, thinner equity at origination, and an elevated share of loans written above the value of the collateral remain the watchpoints, compounding duration and collateral risk across the book even as credit quality holds.
Bottom Line: The July 2026 Dealertrack Credit Availability Index closed at 105, its highest level since December 2015. The advance was driven primarily by a narrowing yield spread and a further improvement in approval rates. A continued pullback in subprime share served as the primary offset to index growth. Extended loan terms at a record 31.1% and elevated negative equity continue to present risk potential as the index improves.
View historical Dealertrack Credit Availability Index reports.
The Dealertrack Credit Availability Index tracks six factors that affect auto credit access: loan approval rates, subprime share, yield spreads, loan term length, negative equity and down payments. Reported monthly, the index indicates whether access to auto credit is improving or declining. This typically means that it is cheaper and easier for consumers to obtain a loan or more expensive and harder. The index is published around the tenth of each month.