New-vehicle prices increased in July to $49,855, the highest level of 2026, according to new data from Kelley Blue Book, a Cox Automotive brand. The average transaction price (ATP) was higher year over year by 1.9% but remained below the all-time peak reached in December 2025 of $50,612. New-vehicle sales in July were lower year over year by 1.5% and mostly flat compared to June, as the market slowed and buyers continued to migrate to lower-priced vehicles.
Generally speaking, the sales mix is helping hold down industry average prices. Many high-volume segments, including subcompact SUVs, compact cars, and mid-size cars – segments priced well below industry average – saw year-over-year sales gains last month, while sales of full-size pickups, full-size SUVs and many luxury segments were comparatively softer. As the new-vehicle sales mix leans toward lower-priced vehicles, inflation trends are held below long-term averages.
New-Vehicle Average Transaction Price
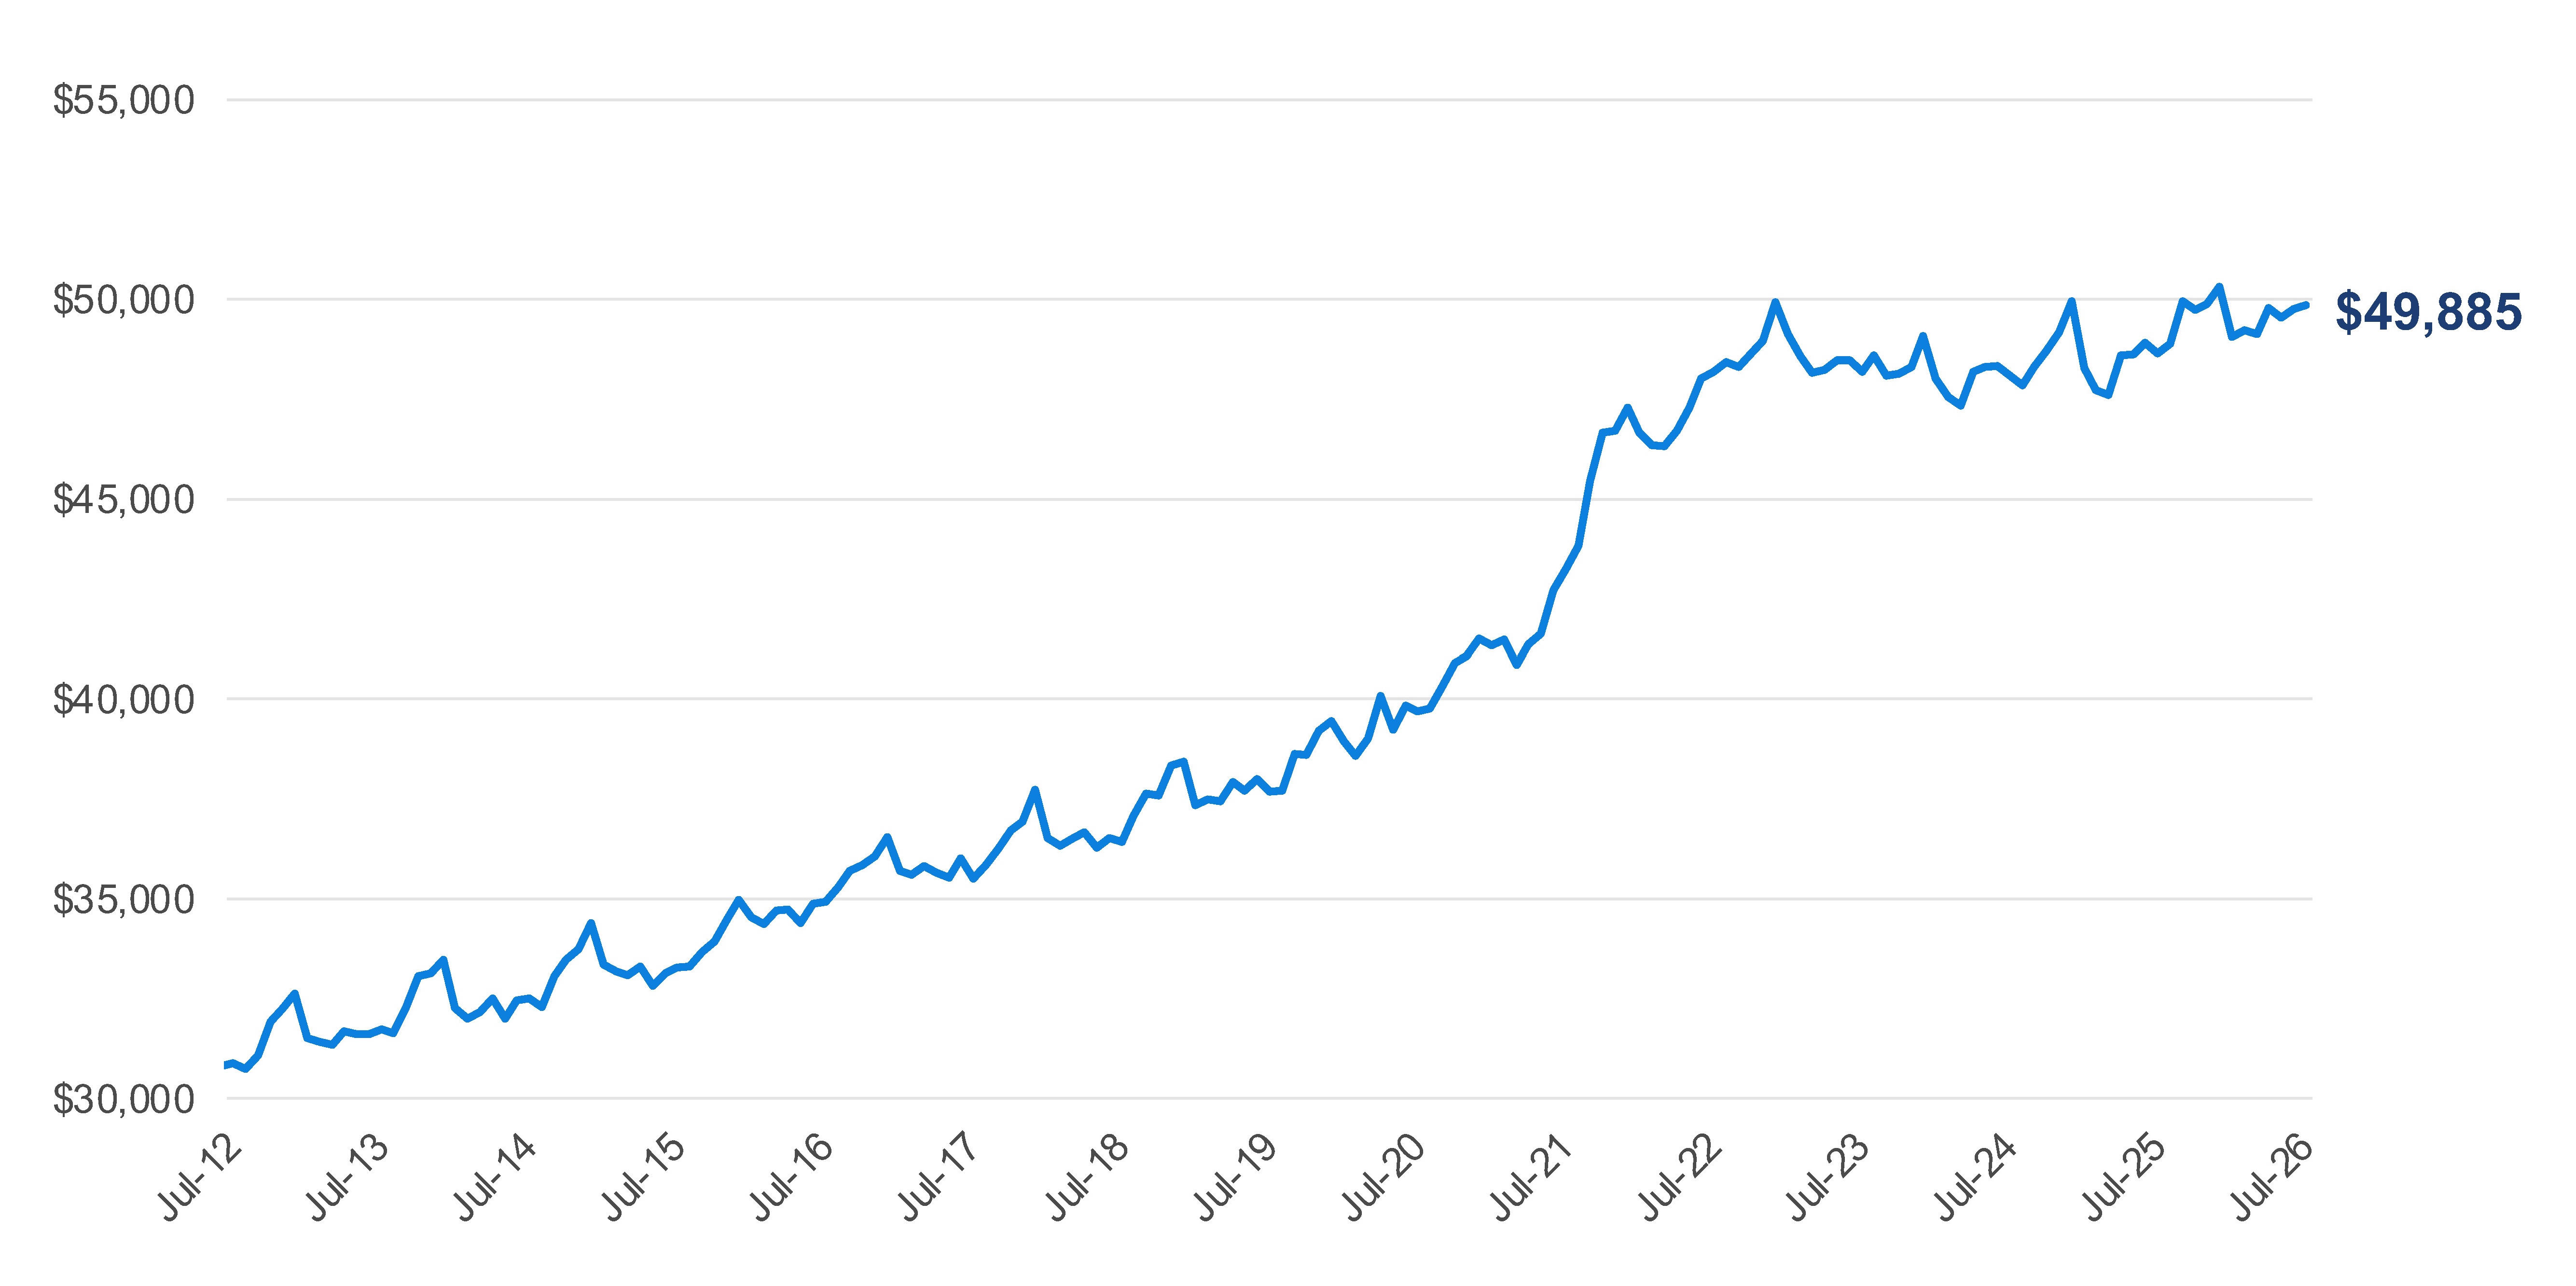
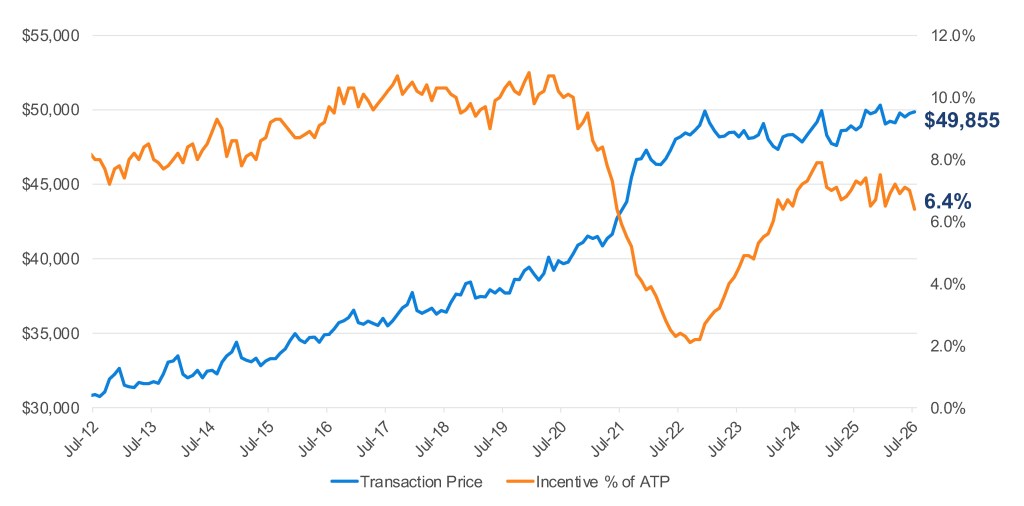
- Industry ATP: According to Kelley Blue Book, the ATP for a new vehicle in June was $49,758, an increase of 0.6% year over year and higher by 0.4%. The average transaction price (ATP) for a new vehicle in July was $49,855, an increase of 1.9% year over year and higher by 0.2% from June. ATPs typically trend lower in July; the long-term monthly move is a decline of 0.1%. The industry average ATP has increased 0.9% since January, a historically typical gain.
- Industry MSRP: The new-vehicle manufacturer’s suggested retail price (MSRP) – commonly called “the asking price” – was $51,621 in July, also higher year over year by 1.9%. Compared to June, MSRPs were lower by 0.1%. The long-term average annual MSRP increase is 3.4%, suggesting new-vehicle price inflation continues to track below long-term averages.
- Incentives: Incentive spending declined in July and was lower for the second consecutive month, falling to 6.4% of ATP. In June, the average incentive package was equal to 7% of ATP. A year ago, incentive spending averaged 7.3% of ATP. Incentive spending last month was at the lowest point since January. Spending was elevated in many of the best-selling segments, including full-size pickup trucks (8.6%), compact SUVs (7.8%) and mid-size SUVs (6.8%).
- Segments: Among the five best-selling vehicle segments in June, annual ATP gains in June remained well above the industry average of 0.6% and closer to long-term average annual gains. By volume, the top five segments accounted for 63% of total industry sales, a slight increase from June 2025. Transaction prices in the largest segments were:
- Midsize SUV: $50,144, up 2.4% year over year
- Compact SUV: $37,745, up 2.7% year over year
- Full-size pickup truck: $66,980, up 2.8% year over year
- Subcompact SUV: $31,052, up 1.1% year over year
- Compact car: $27,904, up 2.6% year over year
Industry Average Transaction Price Versus Industry Average Incentive Spend as % of ATP
Quote from Erin Keating, Executive Analyst, Cox Automotive
“While incentive spending eased in July, that’s only part of the pricing story. We’re also seeing more 2027 model-year vehicles arrive on dealer lots, bringing fresh content, feature updates and higher sticker prices into the market. Consumers continue to gravitate toward more affordable segments, which is helping keep overall transaction price growth in check, but the steady flow of newer vehicles is providing some upward pressure on both ATPs and MSRPs.”
Electric Vehicle Prices Increase as Incentives Decline
- Electric Vehicle ATP: EV prices have increased for two consecutive months, and July marks the first positive year-over-year reading since December 2025, ending a six-month streak of annual declines. The average price paid for a new EV was $56,126 in July, up 1.2% month over month and 1.6% year over year.
- EV Incentives: Electric-vehicle incentives declined to $6,626 in July, down 9.1% from June and 24.3% year over year. Incentives as a percent of ATP were 11.8%, down from 15.8% a year ago, but remained well above the industry average of 6.4%.
- Tesla ATPs: Tesla prices increased to $53,891 in July, up 1.5% month over month and 1.6% year over year, while incentives fell to $5,599, down nearly 34% from a year ago. Tesla incentives accounted for 10.4% of ATP, compared with 16% a year earlier, suggesting less reliance on incentives as pricing strengthened.
About Kelley Blue Book
Founded in 1926, Kelley Blue Book, The Trusted Resource®, is the vehicle valuation and information source trusted and relied upon by both consumers and the automotive industry for nearly a century. As the industry standard for generations, Kelley Blue Book provides transparent, objective information and data-driven, innovative tools for consumers, automotive dealers and manufacturers. Kelley Blue Book publishes millions of market-reflective values weekly on its top-rated website KBB.com, from its famous Blue Book® Trade-In Values to the Kelley Blue Book® Price Advisor tool, which offers a range for what consumers reasonably can expect to pay for a vehicle in their area. KBB.com editors rate and review hundreds of new vehicles each year to help consumers understand the Best Cars and Best SUVs to meet their needs. Kelley Blue BookSM Instant Cash Offer provides a redeemable trade-in offer to transaction-ready consumers and conveniently connects them to local participating dealers. Kelley Blue Book’s Service Advisor provides guidance on how much to pay for service and repairs, allowing consumers to schedule service with local dealers on KBB.com. Kelley Blue Book also provides vehicle values to finance and insurance companies as well as governmental agencies. Kelley Blue Book is a Cox Automotive brand.