Key Metrics
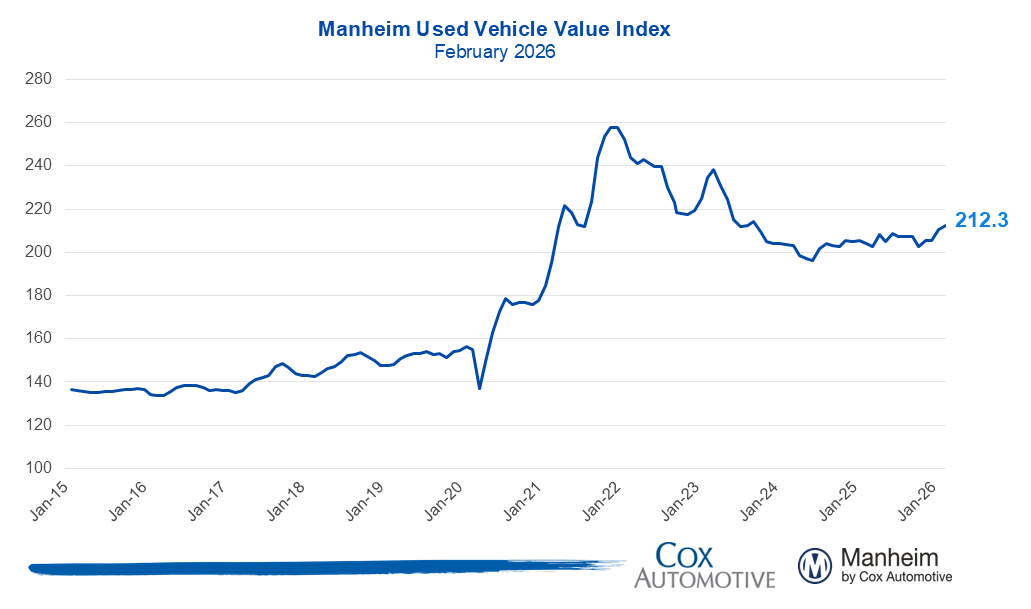
- The Manheim Used Vehicle Value Index (MUVVI) rose to 212.3, reflecting a 4% increase for wholesale used-vehicle prices (adjusted for mix, mileage, and seasonality) compared to February 2025. The February index is up 0.8% month over month. The long-term average monthly move for February is a decrease of 0.2%.
- Non-adjusted wholesale vehicle prices are now up 4.2% year over year, and up 3% against January 2026. The long-term average monthly move in non-adjusted values is an increase of 0.9% in February.
Expert Perspective — Jeremy Robb, Chief Economist, Cox Automotive
“Since the start of 2026, we’ve seen mostly solid demand at Manheim with higher sales conversion rates indicating an appetite from dealers to buy. As we progressed through February, we saw prices move higher than usual, especially in the back half of the month. The last week of January and early February threw some winter weather at dealer groups, which they indicated slowed down traffic as reported in our Q1 Cox Automotive Dealer Sentiment Index, released earlier this week.
Now that we are officially in March, with warmer weather ahead across much of the U.S., we have seen retail demand increasing in our most recent data points – for both new and used sales. The average tax refund is running 10% higher this year, as we hit some of the strongest weeks for consumer filing, and we are expecting to see that translate to more traffic at dealerships in March.
At the same time, recent geopolitical events introduce new risks to the economy, and that may put a damper on consumer appetite in the short run, as people digest the news in the Middle East. This could slow the building pace we see on the back of tax refund season, particularly as gas prices rise. All in, the impact may be more acutely felt early in the month, with a pickup in demand building as we move through March.”
MMR Prices, Retention & Sales Conversion
- MMR prices for the Three-Year-Old Index increased 3.1% in February.
- MMR retention averaged 100.3%, reflecting a 0.3-percentage-point increase both year over year and month over month.
- Sales conversion was 61.5% for the period, 0.4 percentage points higher than the most recent three-year average for February and up 1.4 percentage points from January.
Takeaway: MMR prices for the Three-Year-Old Index increased more than is typical for this period. MMR retention increased slightly and is seasonally strong for this time of year. Meanwhile, sales conversion indicates strengthening demand, increasing consistently since November, and remaining above usual levels for this time of year.
Segment Performance: Year-Over-Year Price Changes
Overall market prices were up notably from a year ago, led by the luxury segment and non-electric vehicles, while compact cars and trucks posted the weakest gains.
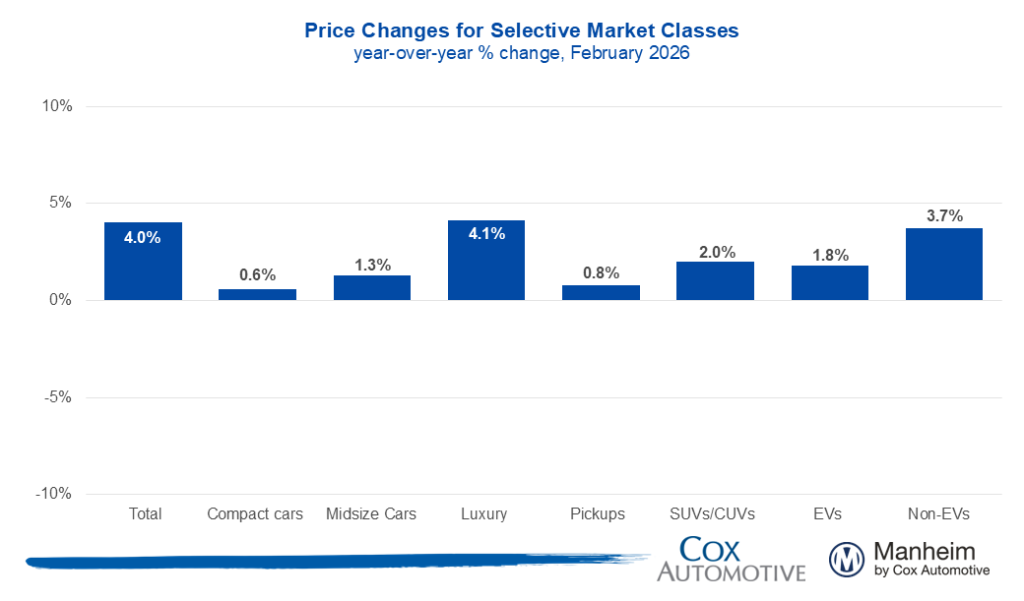
Takeaway: All major vehicle segments are above year-earlier levels; however, the luxury segment continues to outperform the overall market. Continued strength in this segment has been observed throughout the past year. Compact cars and trucks continue to see relatively weak price growth compared to this time last year.
EV versus Non-EV Index
- EVs: The Electric Vehicle (EV) Index was up 1.8% year over year and up 0.8% from January.
- Non-EVs: The Non-EV Index was up 3.7% year over year and higher by 0.9% from January.
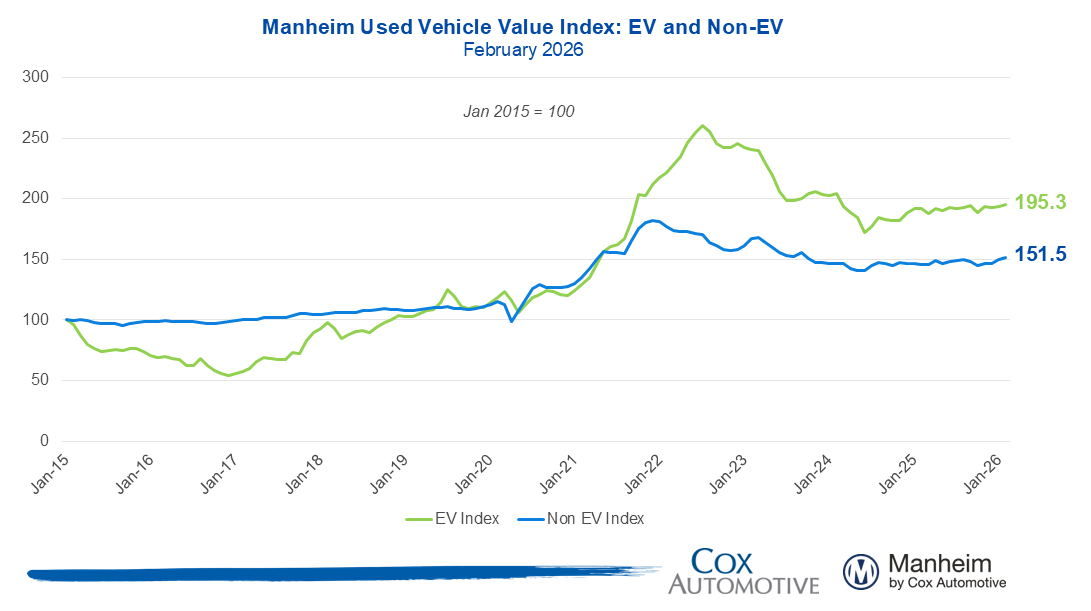
Takeaway: With the expiration of government-backed EV incentives, prices moderated, but they remain notably higher than a year ago, when EV values saw much more depreciation in the first half of the year.
Wholesale Supply
- Wholesale supply: At the end of February, wholesale days’ supply fell to 26.7 days, higher by 0.6 days year over year and lower by 0.1 days compared to January.
- Rental prices: Prices for rental vehicles are higher by 9.1% year over year, as they climbed in February, up by 6% from January. Rental values on a non-seasonally adjusted basis are 8.6% above 2025’s level and rose 7.1% in February, driven by lower average mileage, down 25.2% against last February overall.
Takeaway: Before the pandemic, wholesale vehicle days’ supply averaged 31 days at the end of February. Days’ supply in February was lower than historical norms but experienced a smaller decline than is typical from January.
View historical MUVVI reports here.
For more information on Manheim, visit Manheim.com.
The Manheim Used Vehicle Value Index (MUVVI) is a trusted benchmark for tracking wholesale used-vehicle prices in the U.S., which helps dealers and analysts gauge market shifts and anticipate retail trends. The official measure is reported on the fifth business day of each month. The mid-month MUVVI number is a checkpoint number, is not an official reading and should not be compared to the official index reading. The mid-month is not a flash estimate, and it is not meant to provide any directional estimate of the full-month number. The next complete suite of monthly MUVVI data will be released on Tuesday, April 7, 2026. Register to attend the Q1 MUVVI call on Tuesday, April 7, 11 a.m. EDT.
For questions or to request data, please email manheim.data@coxautoinc.com. If you want updates about the Manheim Used Vehicle Value Index, as well as direct invitations to the quarterly call sent to you, please sign up for our Cox Automotive newsletter and select Manheim Used Vehicle Value Index quarterly calls.
Note: The Manheim Used Vehicle Value Index was adjusted to improve accuracy and consistency across the data set as of the January 2023 data release. The starting point for the MUVVI was adjusted from January 1995 to January 1997. The index was then recalculated with January 1997 = 100, whereas prior reports had 1995 as the baseline of 100. All monthly and yearly percent changes since January 2015 are identical. Learn more about the decision to rebase the index.