Key Metrics
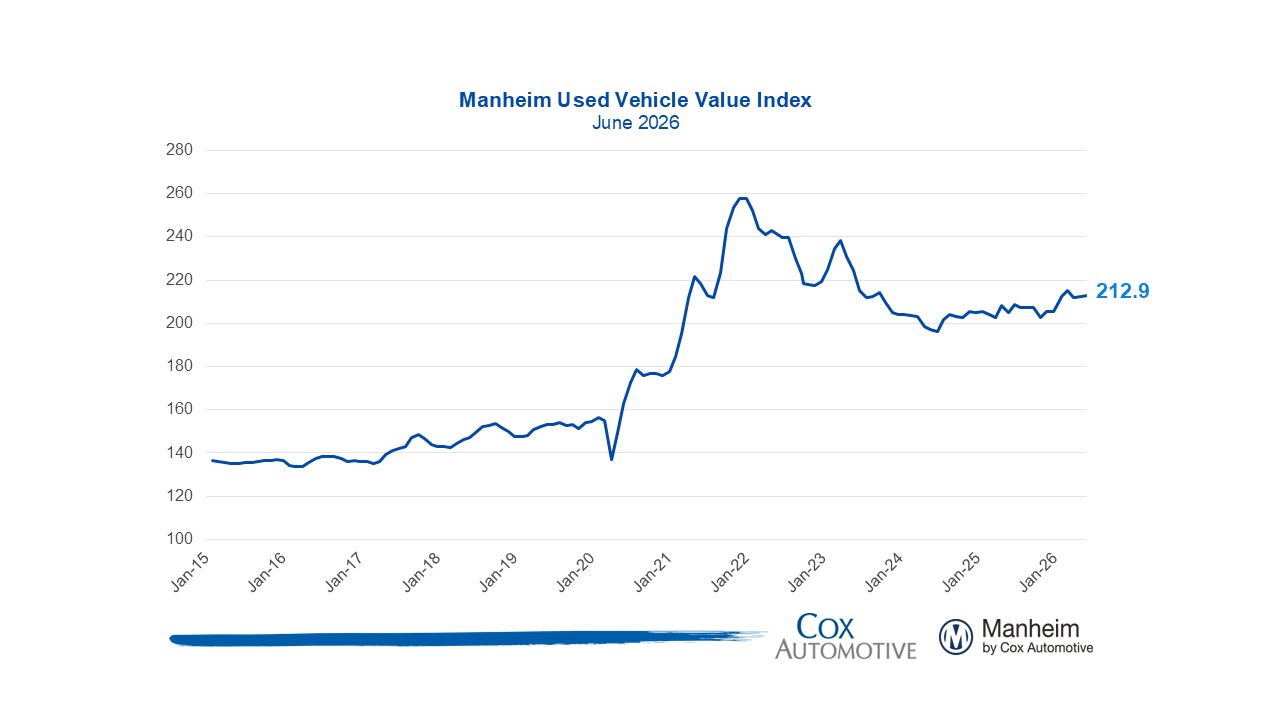
- The Manheim Used Vehicle Value Index (MUVVI) rose to 212.9, reflecting a 2.1% increase for wholesale used-vehicle prices (adjusted for mix, mileage, and seasonality) compared to June 2025. The June index is up 0.1% month over month. The long-term average monthly move for June is an increase of 0.5%.
- Non-adjusted wholesale vehicle prices are now up 2.9% year over year, and down 1.3% against May 2026. The long-term average monthly move in non-adjusted values for June is a decrease of 0.5%.
Expert Perspective — Jonathan Gregory, Senior Director, Cox Automotive
“The first half of the year is officially in the books, and wholesale values finished on solid footing. The Manheim Index closed June up 2.1% against last year and essentially flat on the month, slightly below the typical gain for June. The story of the first half is a strong tax-refund season that pushed values to levels we haven’t seen in a few years, peaking in March before normalizing, leaving the index about 1% off that March high.
I’d caution against reading too much into the softer year-over-year print: the deceleration from May’s 3.6% to June’s 2.1% is mostly a base effect, as we’re now lapping last June, when values were still climbing on tariff-induced demand.
The bigger picture remains one of balance. Sales conversion, our clearest read on dealer demand, came in at 57.5%, still 2.6 points above the three-year norm for June even as the rate itself has eased steadily since spring. Days’ supply at wholesale finished June at 26.9 days — a bit above last year but comfortably within seasonal bounds.
Affordability is the throughline in the first half of 2026. We’ve seen stronger appreciation in older units this year, and the most affordable segments have been among the year’s best performers. The risk we’re watching for the second half is that steep ramp in off-lease supply, EVs especially, which could pressure specific segments even as the headline holds firm. Gas is the swing factor: If pump prices keep falling, some of that EV demand could fade as availability increases.”
MMR Prices, Retention & Sales Conversion
- MMR prices for the Three-Year-Old Index decreased 1.9% in June.
- MMR retention averaged 99.4%, up 0.2 percentage points year over year and down 0.1 percentage points from May.
- Sales conversion was 57.5% for the period, 2.6 percentage points higher than the most recent three-year average for June but down 1.4 percentage points from the May rate.
Takeaway: MMR prices for the Three-Year-Old Index decreased less than the typical amount for this period. MMR retention fell less than is seasonally normal for this time of year, while sales conversion indicates demand remains above usual levels for this time of year, despite softening in recent weeks.
Segment Performance: Year-Over-Year Price Changes
Overall market prices were up from a year ago, led by continued EV strength and Luxury while affordable Compact Cars have shown relative strength in the past few months.
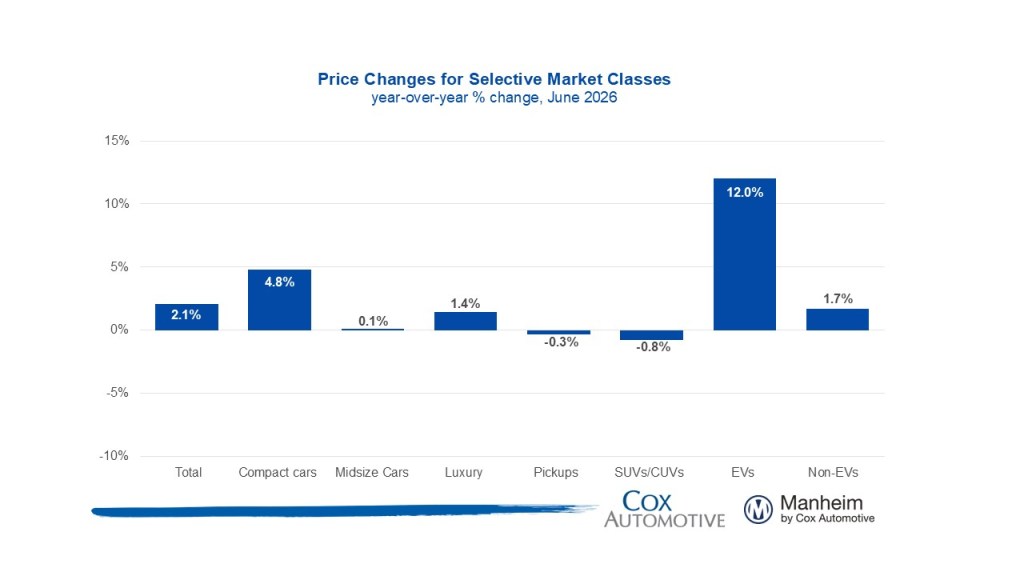
Takeaway: EVs continue to show strong performance, while prices for SUVs and Pickups falter compared to this time last year.
EV versus Non-EV Index
- EVs: The Electric Vehicle (EV) Index was up 12% year over year and up 1.7% from May.
- Non-EVs: The Non-EV Index was up 1.7% year over year and up 0.2% from May.
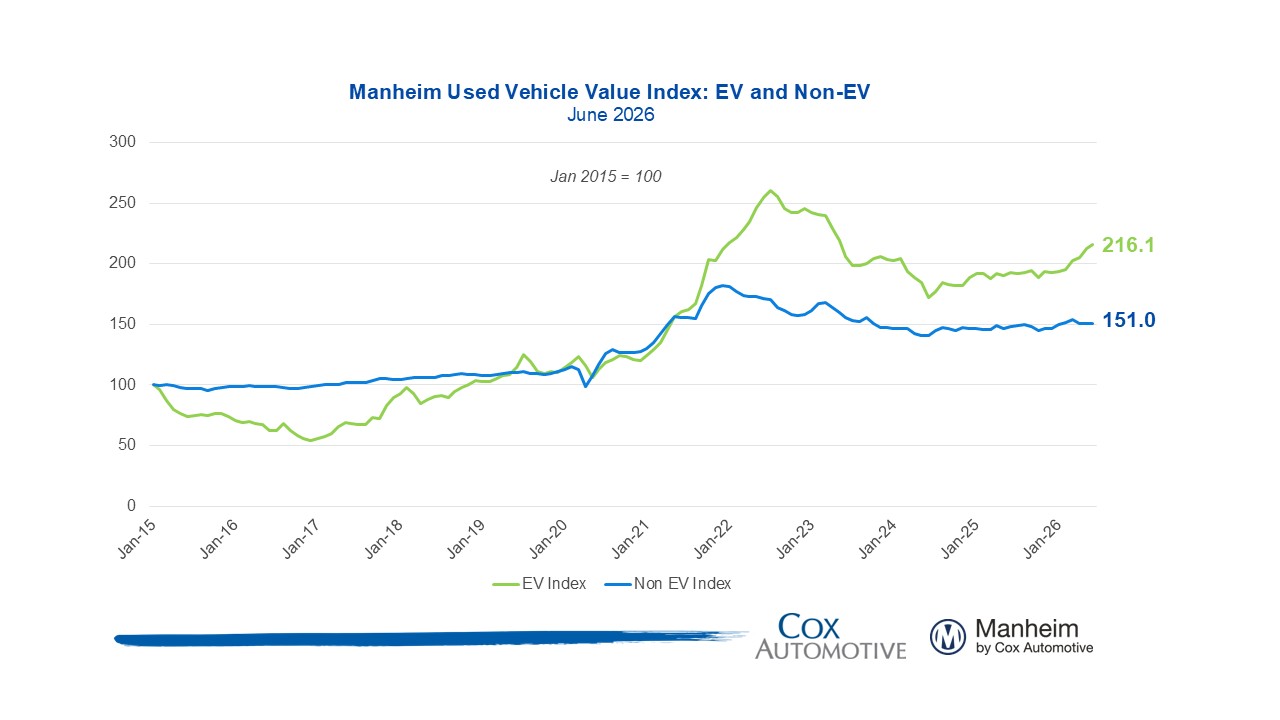
Takeaway: Both EV and Non-EV continue to see elevated prices against this time last year, with EVs showing continued growth even as availability improves, while Non-EVs held essentially steady.
Wholesale Supply and Rental Prices
- Wholesale supply: At the end of June, wholesale days’ supply rose to 26.9 days, higher by 1.3 days year over year and higher by 0.1 days compared to May.
- Rental prices: Prices for rental vehicles are higher by 1.2% year over year, falling slightly in June, down by 0.1% from May. Rental values on a non-seasonally adjusted basis are 1.3% above 2025’s level but declined 2% in June, while having lower average mileage, down 6.6% against last June.
Takeaway: Days’ supply in June was elevated against last year, yet remains within seasonal boundaries. Rental values fell against May, while average mileage increased month over month.
View historical MUVVI reports here.
For more information on Manheim: VISIT MANHEIM.COM
The Manheim Used Vehicle Value Index (MUVVI) is a trusted benchmark for tracking wholesale used-vehicle prices in the U.S., which helps dealers and analysts gauge market shifts and anticipate retail trends. The official measure is reported on the fifth business day of each month. The next complete suite of monthly MUVVI data will be released on June 7, 2026.
For questions or to request data, please email manheim.data@coxautoinc.com. If you want updates about the Manheim Used Vehicle Value Index, as well as direct invitations to the quarterly call sent to you, please sign up for our Cox Automotive newsletter and select Manheim Used Vehicle Value Index quarterly calls.
Note: The Manheim Used Vehicle Value Index was adjusted to improve accuracy and consistency across the data set as of the January 2023 data release. The starting point for the MUVVI was adjusted from January 1995 to January 1997. The index was then recalculated with January 1997 = 100, whereas prior reports had 1995 as the baseline of 100. All monthly and yearly percent changes since January 2015 are identical. Learn more about the decision to rebase the index.