
The electric vehicle (EV) market showed modest improvement in July as both new and used EV sales increased. Inventory remained relatively balanced, while growing off-lease returns and trade-ins expanded used EV availability. New EV pricing rose modestly as incentives declined, while used EV values remained elevated compared with a year ago.
New and Used EV Sales – July
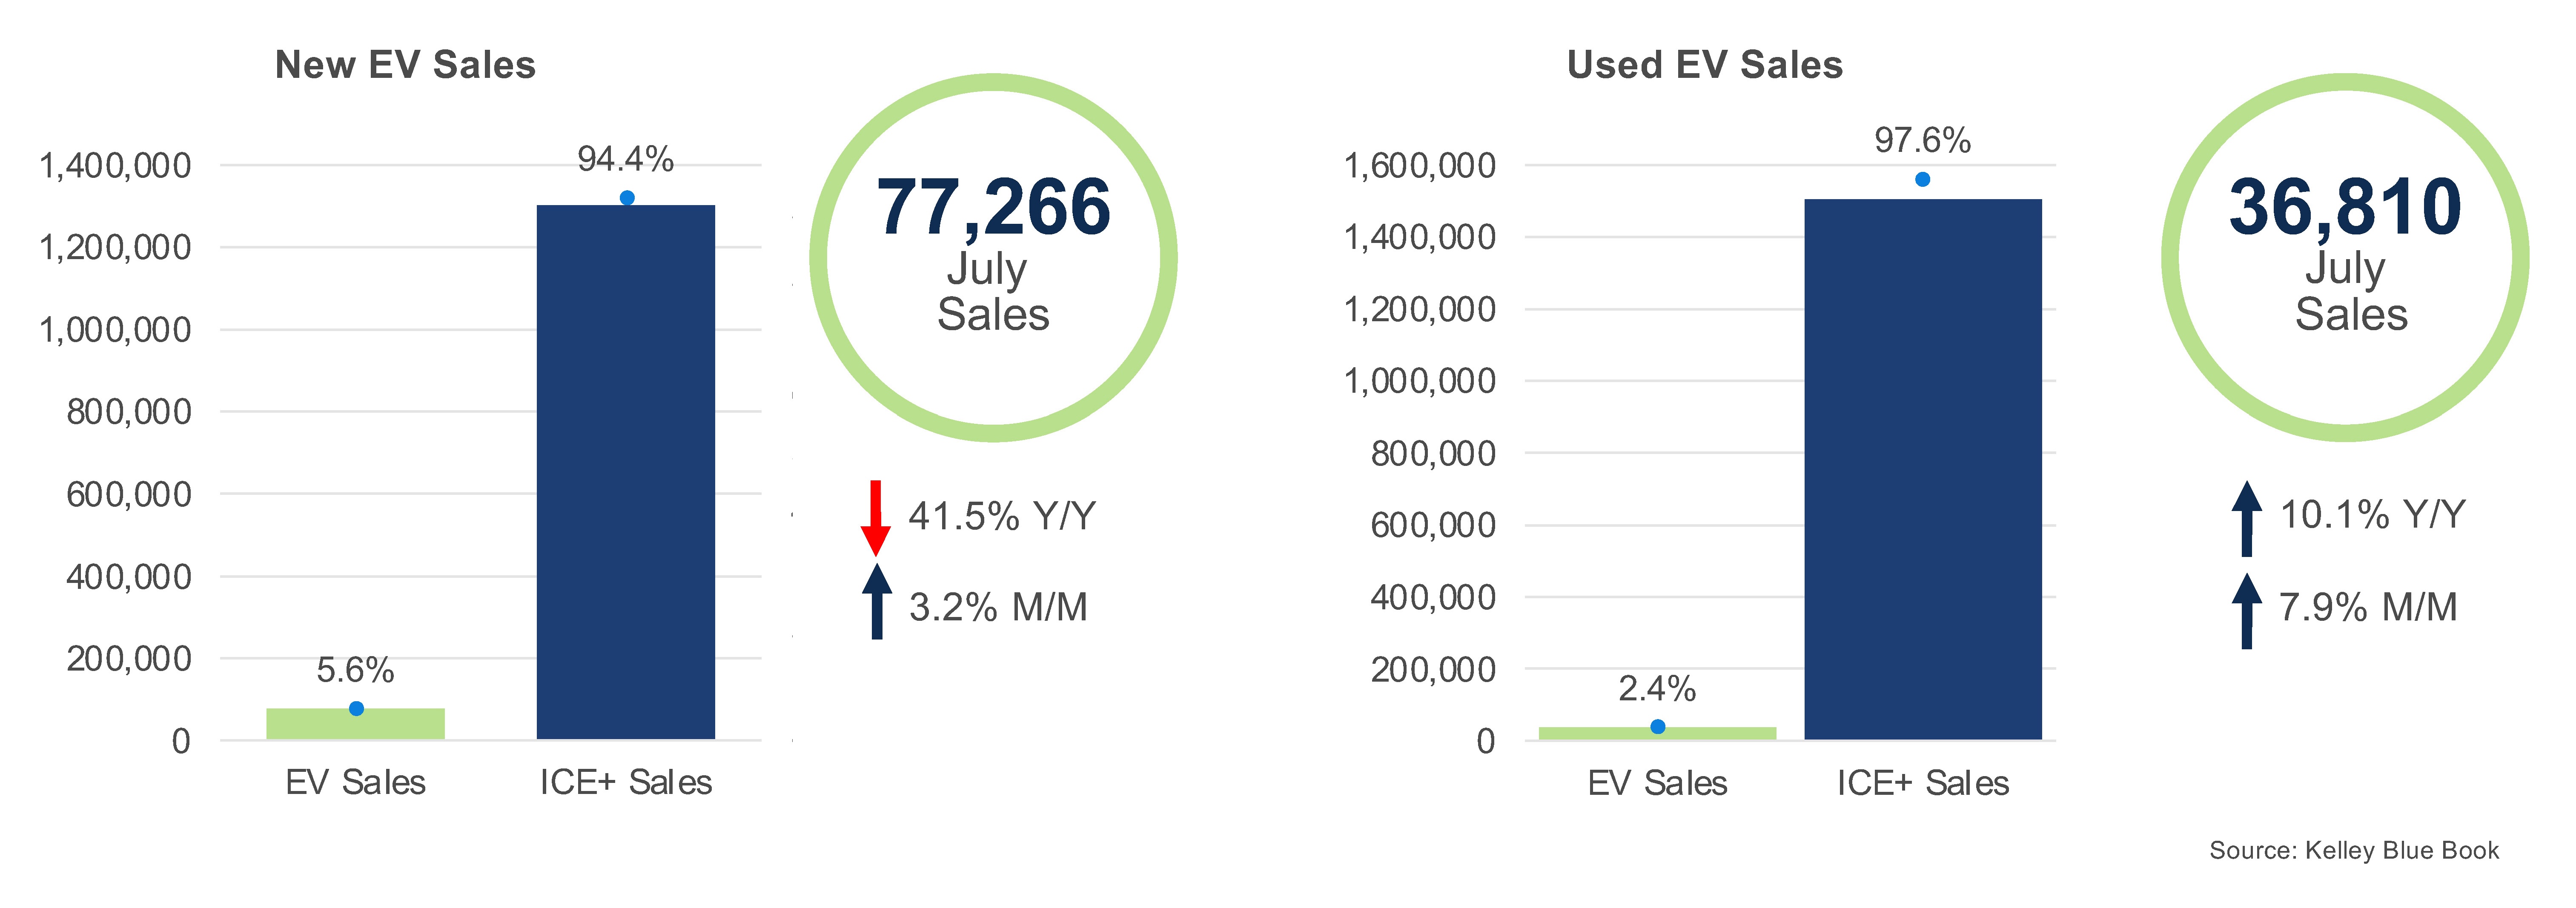
New EV Sales: New EV sales totaled an estimated 77,266 units in July, up 3.2% from June and down 41.5% from a year earlier. EVs accounted for 5.6% of total new-vehicle sales, a slight improvement from June, though the market remained well below year-ago levels, when demand was supported by consumers accelerating purchases before the federal EV tax credit expired.
Tesla remained the volume leader with 42,435 units sold, followed by Rivian, Hyundai, Toyota, and Cadillac. Tesla’s share of total EV sales increased to roughly 55% as its sales rose 4.9% month over month. The Model Y alone accounted for roughly 37% of all new EV sales, generating more volume than the entire EV lineup of any other manufacturer. Hyundai posted the strongest month-over-month gain among high-volume brands, with sales rising 36% from June. Kia also posted solid gains, led by continued strength from the EV9.
Used EV Sales: Used EV sales increased 7.9% month over month and 10.1% year over year in July to 36,810 units. Market share held steady at 2.4%, led by Tesla, while Hyundai, Ford, BMW, and Chevrolet rounded out the top five brands.
Tesla remained the primary driver of used EV market growth, supported by strong gains from Ford, Chevrolet, Nissan, and Cadillac. Ford posted the strongest growth among high-volume brands, with sales increasing 18.9% from June. Several high-volume models, including the Tesla Model 3, Tesla Model Y, Ford Mustang Mach-E, Hyundai IONIQ 5, Chevrolet Blazer, and Cadillac LYRIQ, helped drive July’s growth.
New and Used EV Days’ Supply – July
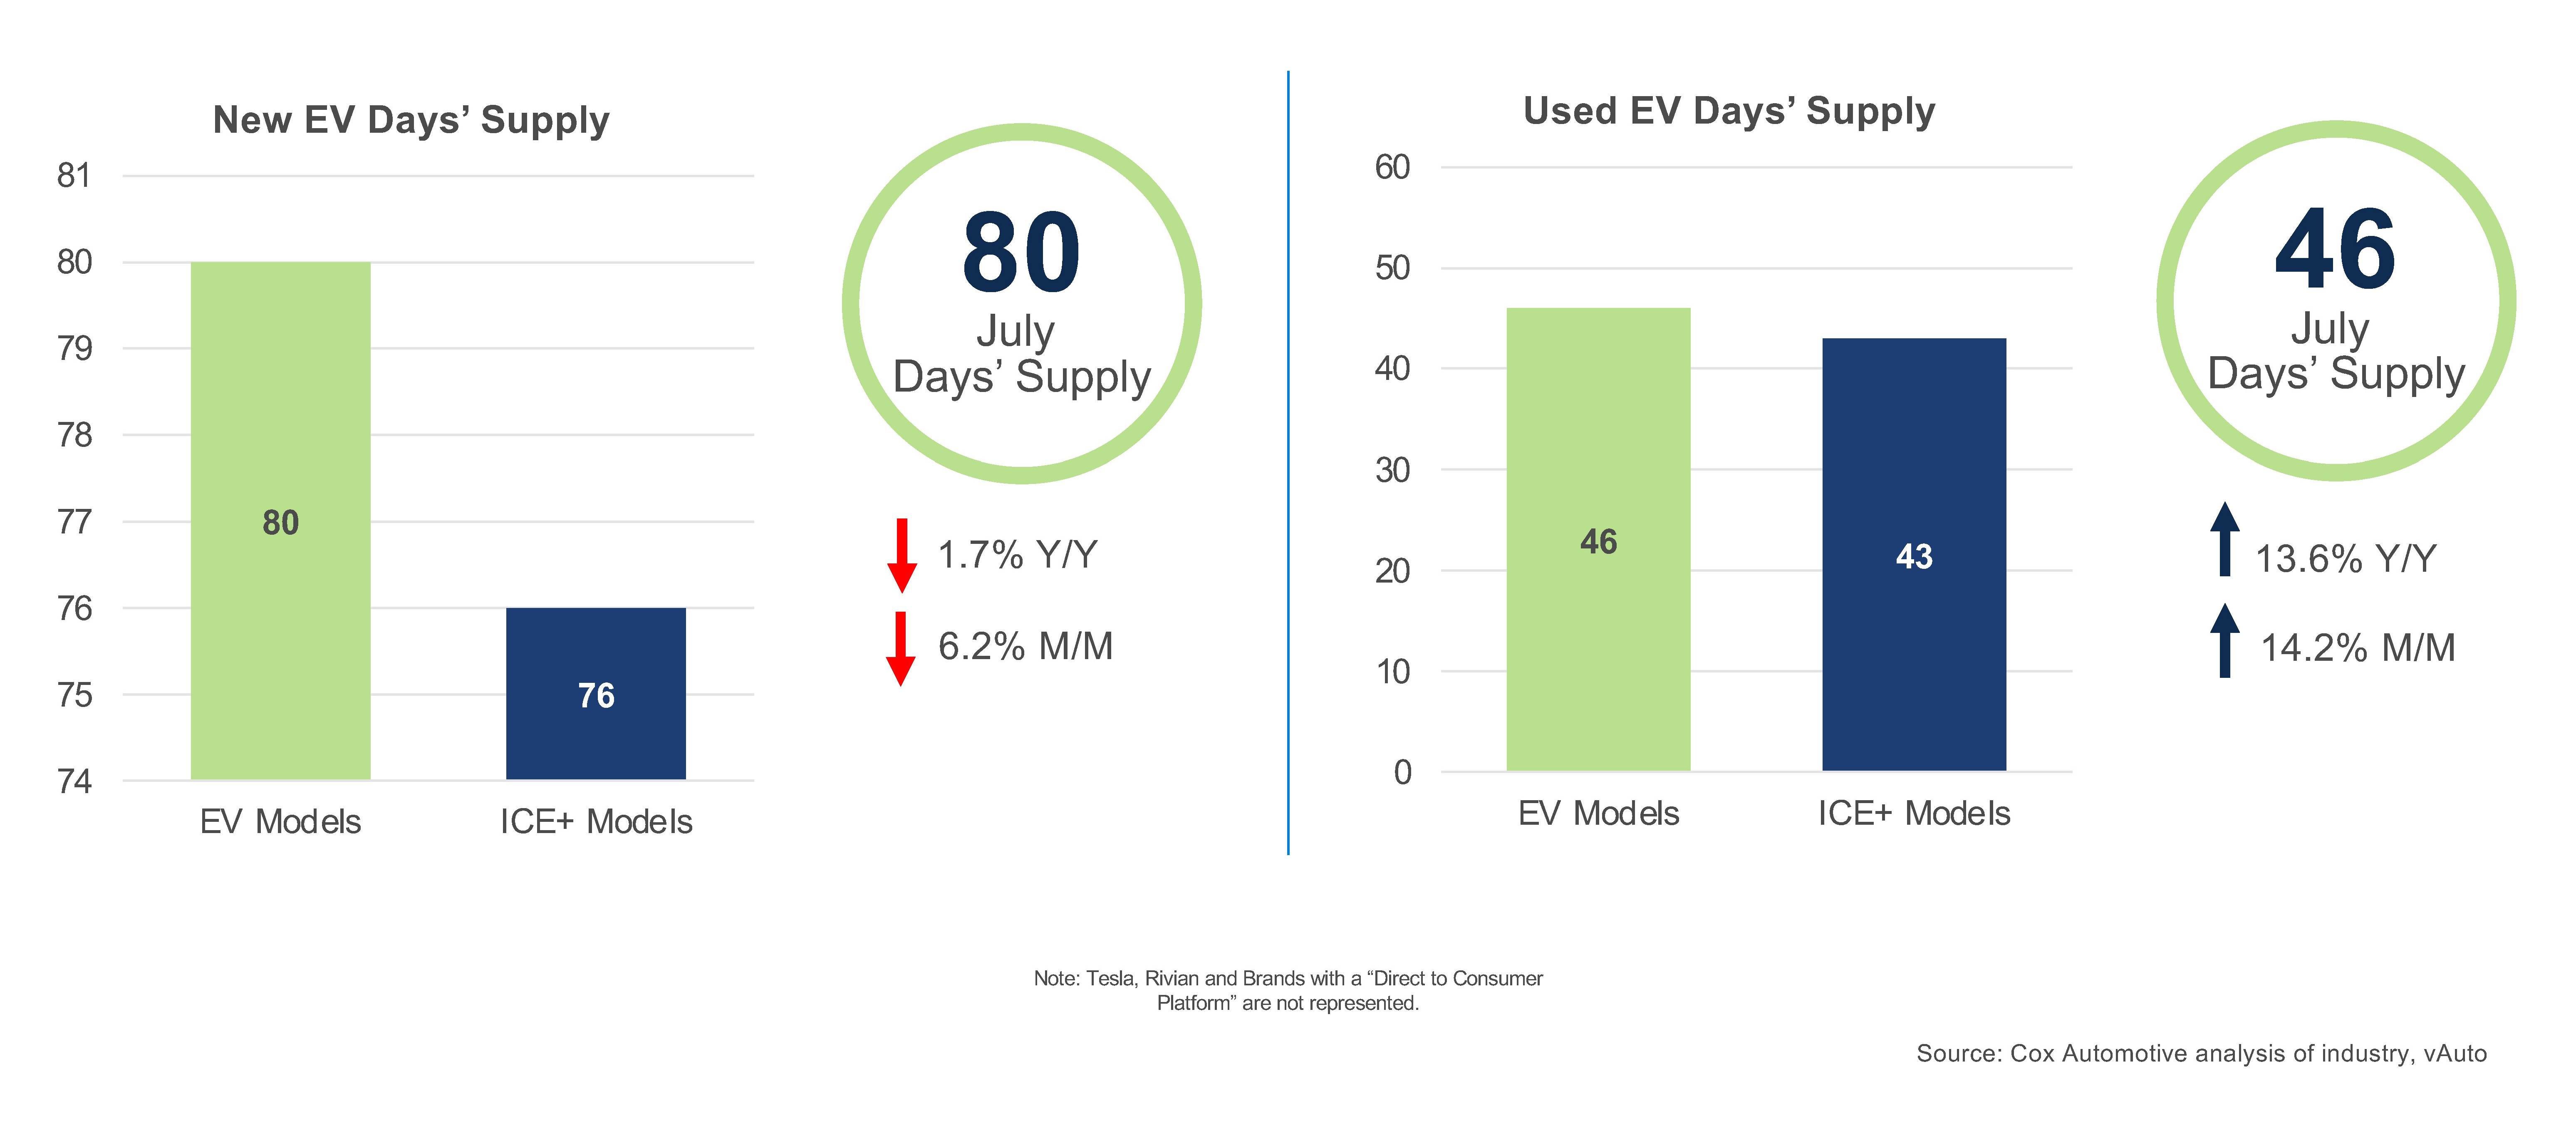
New EV Days’ Supply: Days’ supply decreased to 80 days in July, down 6.2% month over month and 1.7% year over year. EV inventory remained above ICE+ levels, but the gap narrowed significantly from nine days in June to four days in July, reflecting improved inventory alignment with demand.
Inventory levels remained uneven among manufacturers. Volkswagen held the highest days’ supply among major brands at 147 days, followed by Porsche at 138 and Nissan at 133. Subaru had the leanest days’ supply at just 46 days, followed by Hyundai at 52 days and Lexus at 58.
Used EV Days’ Supply: Days’ supply rose to 46 days in July, up 14.2% month over month and 13.6% year over year. Used EV days’ supply moved above ICE+ levels for the first time since February 2026, though the gap between the two remained narrow at just three days.
Inventory growth was concentrated among several high-volume brands, led by Rivian, whose days’ supply jumped 55% month over month to 54 days. Ford held the highest days’ supply overall at 63 days, while Tesla remained the leanest at 38 days. Despite the broader increase in inventory levels, the narrow three-day premium over ICE+ indicated used EV inventory remained broadly aligned with demand.
Note: Tesla and Rivian figures reflect only vehicles available through traditional dealerships and exclude vehicles at factory-owned outlets.
New and Used EV Prices – July
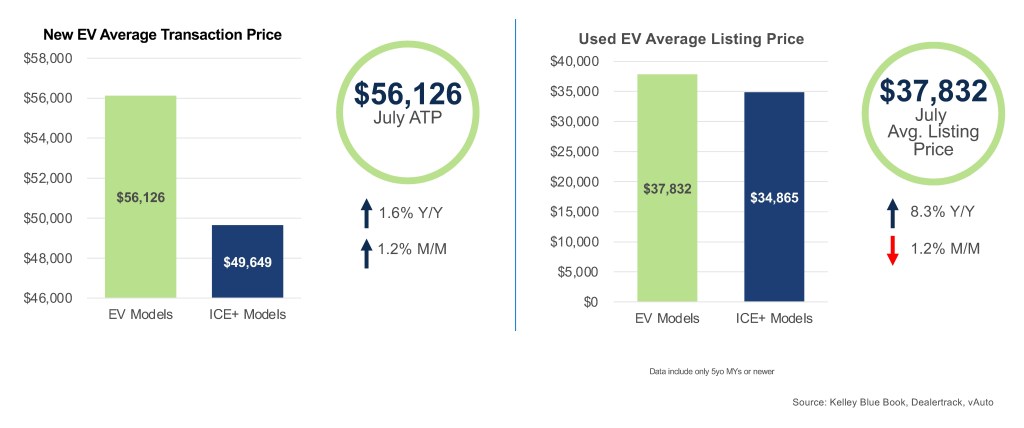
New EV ATP: The average transaction price (ATP) for a new EV rose to $56,126 in July, up 1.2% month over month and 1.6% year over year. Incentives declined to 11.8% of ATP, or approximately $6,626 per vehicle, down from 13.1% and $7,290 in June. The EV price premium over ICE+ vehicles widened to $6,477.
The Tesla Model 3 and Model Y remained the highest-volume models, with ATPs of approximately $50,500 and $52,500, respectively. At the same time, higher-priced vehicles such as the Kia EV9, Hyundai IONIQ 9, Cadillac LYRIQ, Cadillac OPTIQ, and several luxury models supported the overall market average. The increase in ATP reflected lower incentive spending and a sales mix that included a greater share of higher-priced EVs.
For more details, read the July Kelley Blue Book ATP report.
Used EV Listing Price: The average listing price for a used EV was $37,832 in July, down 1.2% month over month but 8.3% higher year over year. Although prices moderated from June’s elevated level, used EV values continued to outpace the broader used-vehicle market, while ICE+ prices declined 0.2% month over month and increased 3.6% year over year.
The used EV premium over ICE+ narrowed modestly to $2,967 in July, down from $3,344 in June. Higher-priced brands such as Rivian and GMC continued to support the overall average, while high-volume brands including Tesla and Hyundai remained competitively priced. Despite the monthly decline, used EV prices remained well above year-ago levels, reflecting a growing share of newer-generation EVs entering the used market.
Looking Ahead
As year-over-year comparisons continue to normalize following last year’s federal EV tax credit expiration, underlying market trends may become clearer. Inventory remains generally aligned with demand, while declining incentives, evolving pricing dynamics, and growing used EV availability will be key indicators of market performance in the months ahead.
The EV Market Monitor gauges the health of the new and used electric vehicle (EV) markets by monitoring sales volume, days’ supply and average pricing. Each metric will be measured month over month and year over year.
Follow the link to view the entire series of EV Market Monitor reports.
For the official quarterly report on EV sales data, see the Q2 Electric Vehicle Sales Report.