Key Metrics
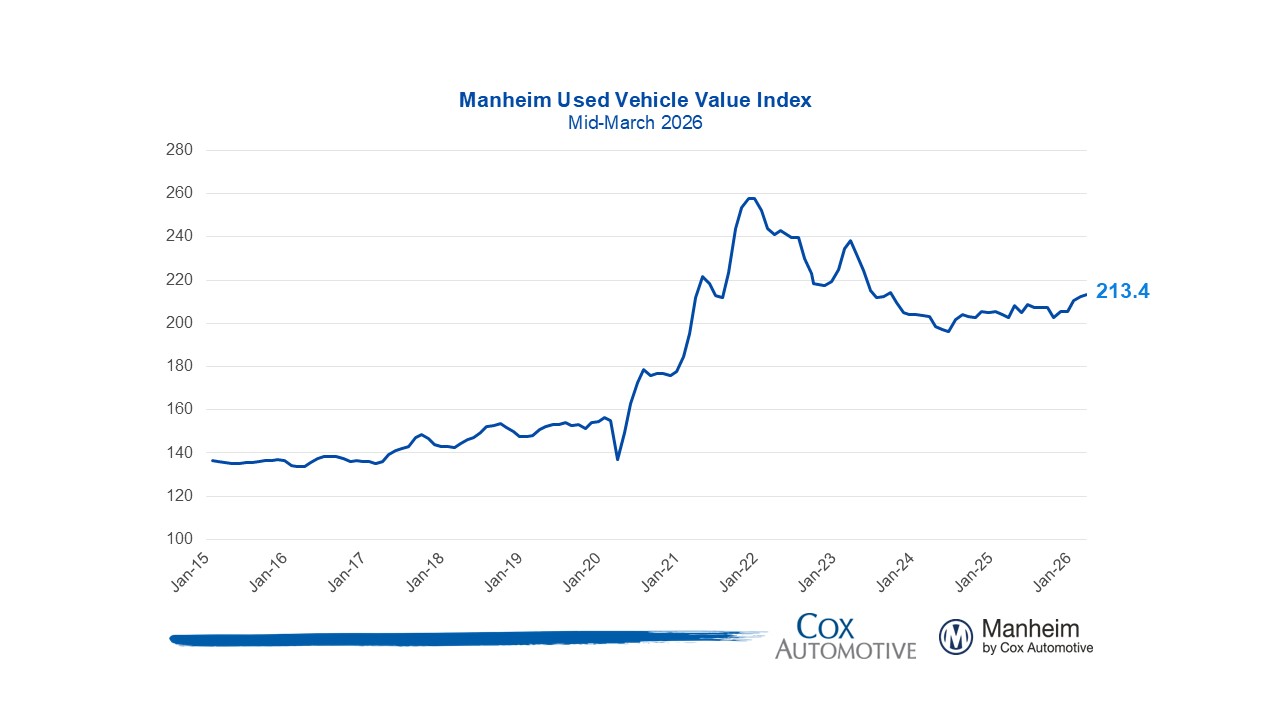
- Manheim Used Vehicle Value Index (MUVVI) increased to 213.4, reflecting a 0.5% increase in wholesale used-vehicle prices (adjusted for mix, mileage, and seasonality) in the first 15 days of March compared to February, and a 5.3% increase compared to March 2025. Seasonally adjusted wholesale values typically show no change on average over the full month.
- Non-adjusted wholesale vehicle prices increased 3.3% in the first half of March from February and are up 4.8% year over year. The long-term average monthly move in non-adjusted values is typically an increase of 3.4% for the full month of March.
Expert Perspective — Jeremy Robb, Chief Economist, Cox Automotive
“The auto market is staying strong through what is typically the strongest seasonal period of the year, even as the conflict in the Middle East casts a shadow over the future outlook.
Tax refunds have continued to boost consumer buying power, with the average refund almost 11% higher than last year. Additionally, our estimates suggest only 35% of all refunds have been sent back to consumers, lower than in recent years, which could mean we see an extended, positive impact on consumer spending patterns well into April.
As we look further down the road, sharp increases in the price of oil can filter into many areas of the economy, particularly if prices remain closer to $100 per barrel. This may spell trouble for a market hoping for more Fed cuts this year, as virtually no one expects a move at the Fed meeting this week – and perhaps not until December.
For now, however, we see better trends in consumer spending patterns, as our retail data has shown five straight weeks of higher sales trends – for both the new and the used markets. These impacts have continued to drive dealers to Manheim, keeping sales conversion high with vehicle appreciation trends that outpace typical seasonal norms.
The bottom line: there’s some longer-term market implications from the conflict in the Middle East, but for now, the data shows no signs of a slowdown in automotive retail, particularly in the used vehicle market.”
MMR Prices, Retention & Sales Conversion
- MMR prices for the Three-Year-Old Index increased 1.6% in the first half of March, a stronger start than we observed last year and against the long-term average.
- MMR retention averaged 100.9% , higher by 0.4 points year over year and up 0.6 points from February.
- Sales conversion averaged 70.2%, higher by 5.5 points year over year and up 7.1 points from February.
Takeaway: MMR depreciation rates continued to be considerably lower than long-term rates early in March. MMR retention and sales conversion both remain above their longer-term run rates, indicating that demand remains strong at Manheim.
Segment Performance: Year-Over-Year Price Changes
Prices in the overall market rose 5.3% year over year, supported by price growth across all major segments and the continued strength of the luxury segment.
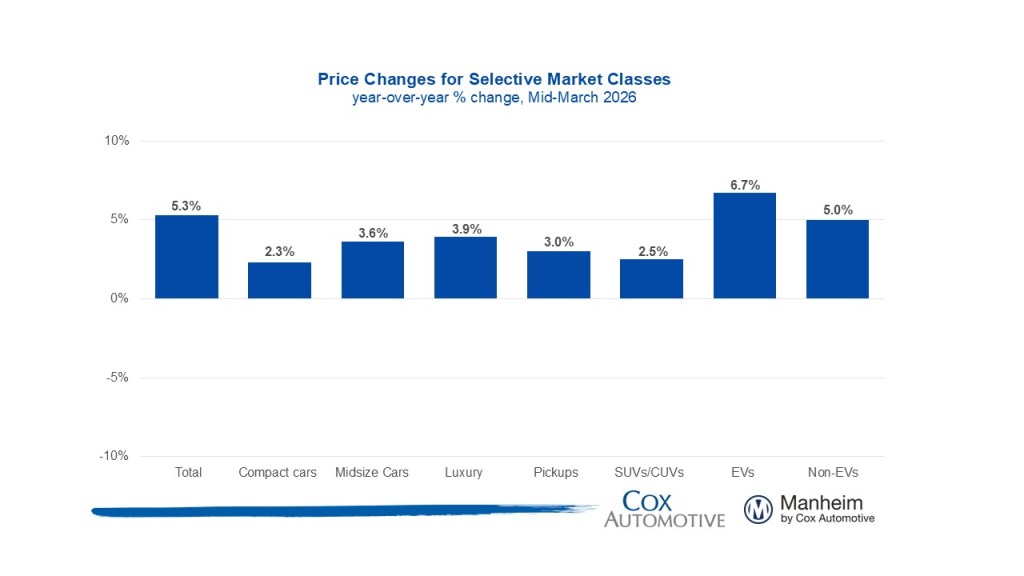
Takeaway: This month saw broad year over year price increases across all major segments, with luxury and EVs leading the way with particularly strong price growth.
EV versus Non-EV Index
- EVs: The Electric Vehicle (EV) Index was up 6.7% year over year and up 2.5% from February.
- Non-EVs: The Non-EV Index was up 5.0% year over year, and it is up 0.8% from February.
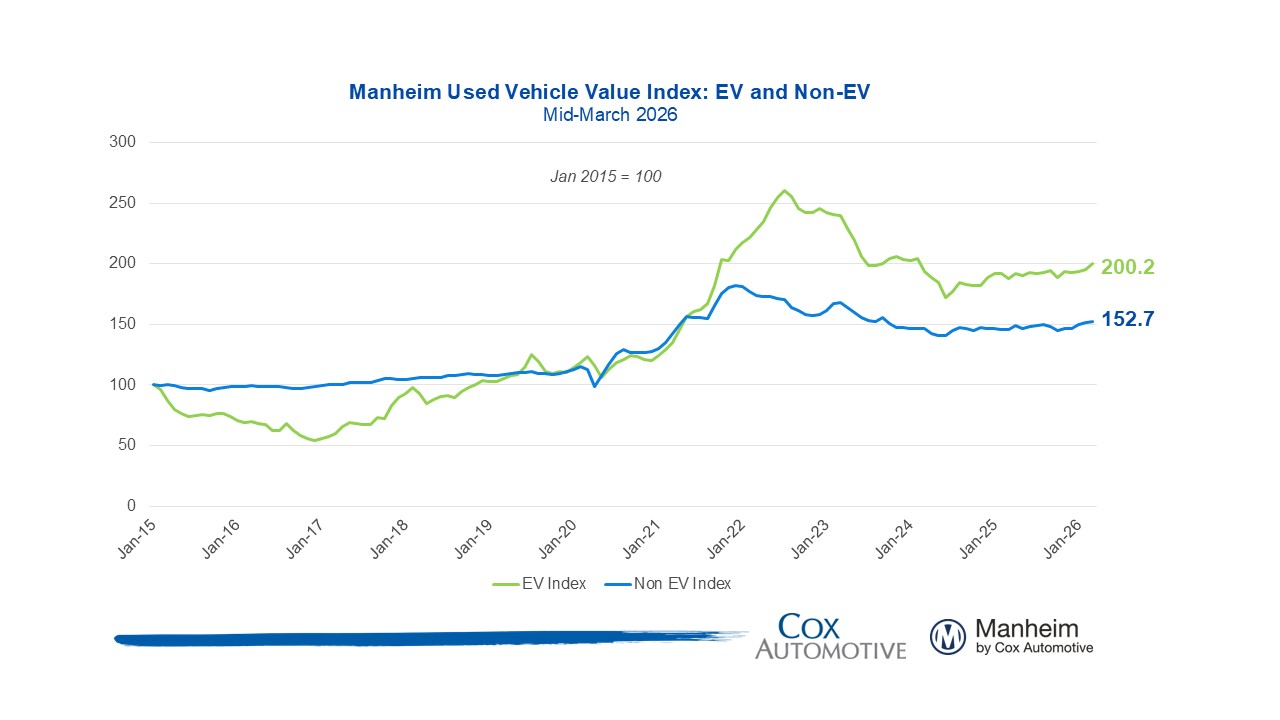
Takeaway: EV and non-EV values have both shown appreciation trends since the start of the year, with EVs seeing stronger increases in recent weeks.
Wholesale Supply
- At the end of February, wholesale vehicle supply reached 27 days, higher than year-earlier levels and flat against the end of January. As of March 15th, days’ supply fell to 25 days.
Takeaway: Wholesale used-vehicle sales outpaced supply through the first half of March, following a steady February.
View historical MUVVI reports here.
For more information on Manheim, visit Manheim.com.
The Manheim Used Vehicle Value Index (MUVVI) is a trusted benchmark for tracking wholesale used-vehicle prices in the U.S., which helps dealers and analysts gauge market shifts and anticipate retail trends. The official measure is reported on the fifth business day of each month. The mid-month MUVVI number is a checkpoint number, is not an official reading and should not be compared to the official index reading. The mid-month is not a flash estimate, and it is not meant to provide any directional estimate of what the full month number will be. The next complete suite of monthly MUVVI data will be released on Tuesday, April 7, 2026.
For questions or to request data, please email manheim.data@coxautoinc.com. If you want updates about the Manheim Used Vehicle Value Index, as well as direct invitations to the quarterly call sent to you, please sign up for our Cox Automotive newsletter and select Manheim Used Vehicle Value Index quarterly calls.
Note: The Manheim Used Vehicle Value Index was adjusted to improve accuracy and consistency across the data set as of the January 2023 data release. The starting point for the MUVVI was adjusted from January 1995 to January 1997. The index was then recalculated with January 1997 = 100, whereas prior reports had 1995 as the baseline of 100. All monthly and yearly percent changes since January 2015 are identical. Learn more about the decision to rebase the index.