Key Metrics
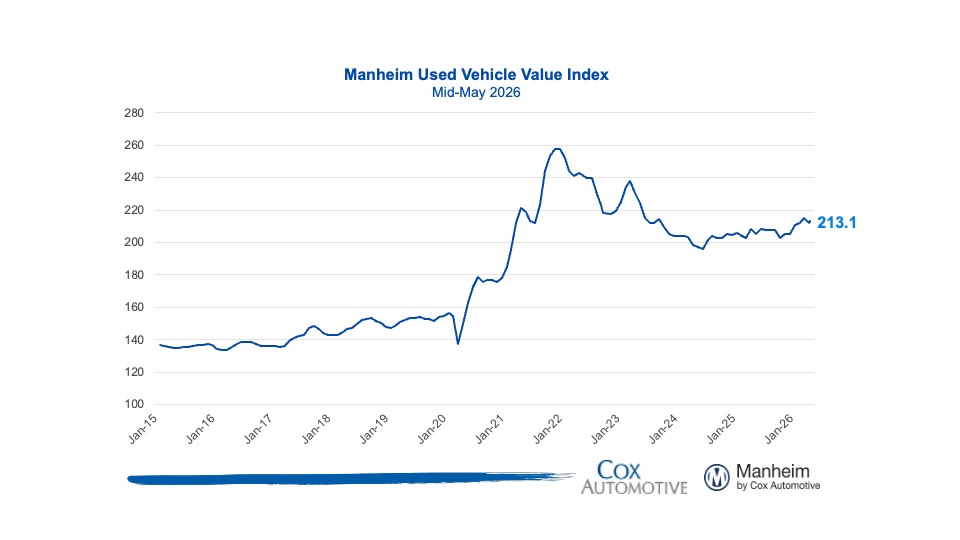
- Manheim Used Vehicle Value Index (MUVVI) increased to 213.1, reflecting a 0.5% increase in wholesale used-vehicle prices (adjusted for mix, mileage, and seasonality) in the first 15 days of May compared to April, and a 3.8% increase compared to May 2025. Seasonally adjusted wholesale values typically increase by about 0.9% on average over the full month.
- Non-adjusted wholesale vehicle prices decreased 1.0% in the first half of May from April and are up 3.3% year over year. The long-term average monthly move in non-adjusted values is typically a decrease of 0.3% for the full month of May.
Expert Perspective — Jeremy Robb, Chief Economist, Cox Automotive
“Wholesale used-vehicle prices moved a bit higher in early May compared to the end of April, and the Manheim Used Vehicle Value Index is holding roughly 4% higher than this time last year. The spring bounce buoyed the market, as a stronger tax refund season drove dealer demand earlier in the year. While the index is now down from its near-term peak in March, depreciation trends have remained muted versus normal seasonal trends.
Nationwide, gas prices have been holding at $4.50 or higher since May 6th. Inflation trends have also been creeping up and may begin to eat into consumer spending appetites as we move into early summer. In the wholesale markets, we continue to see the impact of affordability driving demand, as some of the strongest performing segments are lower priced vehicles in the 8+ year-old range. More demand and higher values in older units tends to lift the Manheim Index overall.
Additionally, we continue to see EV prices rising faster and holding higher than non-EVs. Three-year-old EV prices have outpaced non-EVs for six weeks in a row and are 11% higher than where they started the year. The longer gas prices remain elevated, the more we expect consumers to turn to fuel efficient vehicles. As EV lease maturities continue to increase throughout the summer, it will be critical to follow EV price trends—especially if the Middle East conflict remains unresolved.”
MMR Prices, Retention & Sales Conversion
- MMR prices for the Three-Year-Old Index were down 0.5% over the start of May, weaker than last year, when tariff impacts were driving wholesale values higher. Overall, MMR depreciation in the first half of May was above the long-term average.
- MMR retention averaged 99.7% in the first half of May, higher by 0.6 points year over year and flat against levels from April.
- Sales conversion averaged 61.3% in the first half of May, higher by 4.8 points year over year but down 1.8 points from April.
Takeaway: Seasonal MMR appreciation looks like it is coming to an end, causing slightly elevated depreciation rates in early April. MMR retention is in line with historical norms, and sales conversion remains well above the longer-term run rate, indicating that demand remains strong at Manheim.
Segment Performance: Year-Over-Year Price Changes
Prices in the overall market rose 3.8% year over year, supported by price growth across all major segments, with compact cars and EVs showing particularly strong price growth.
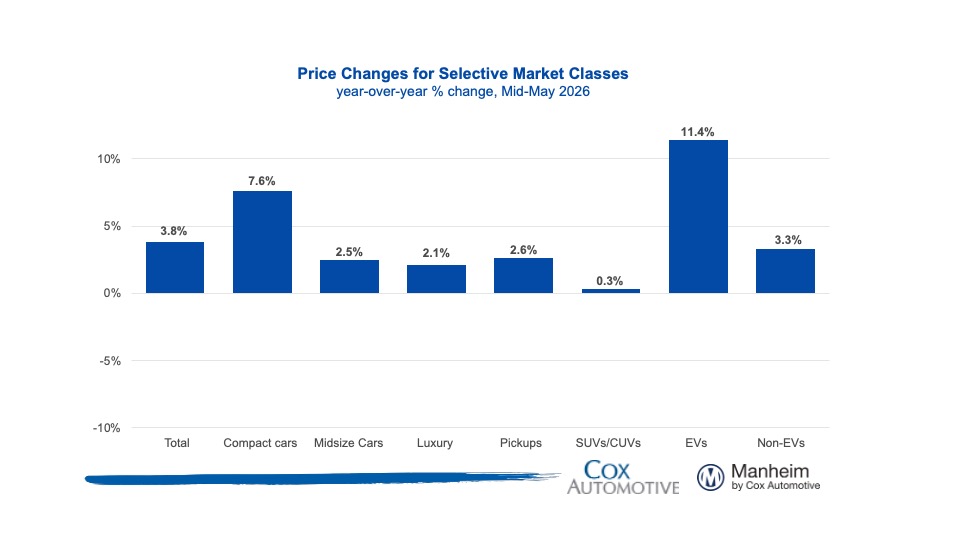
Takeaway: This month saw moderate year-over-year increases across most major segments, with compact and EVs leading the way with strong price growth, while SUVs were particularly soft.
EV versus Non-EV Index
- EVs: The EV Index was up 11.4% year over year and up 3.1% from April.
- Non-EVs: The Non-EV Index was up 3.3% year over year, and it is up 0.2% from April.
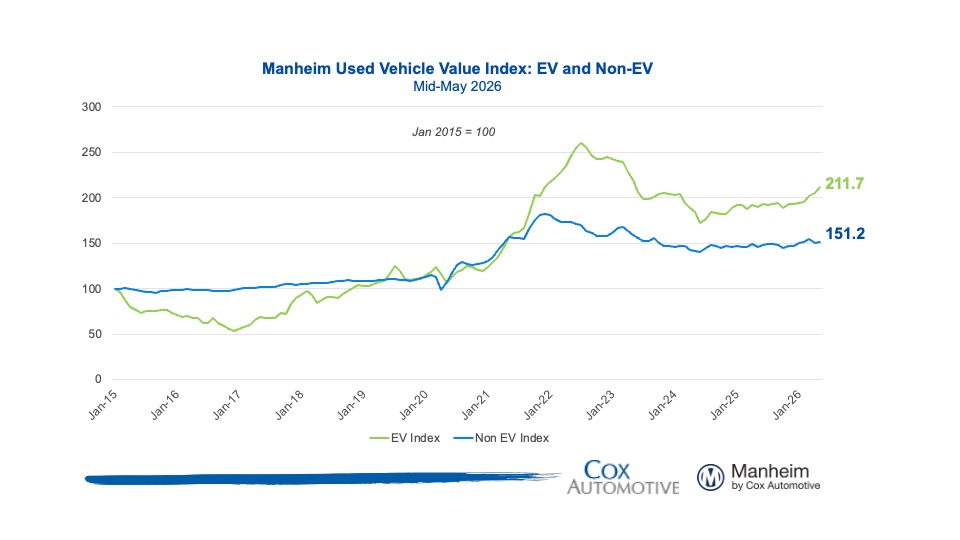
Takeaway: EV and non-EV values have both shown appreciation trends this year, with EVs maintaining strength in recent weeks.
Wholesale Supply
- At the end of April, wholesale vehicle supply reached 25 days, up 1 day against April 2025 and flat against the end of March. As of May 15th, days’ supply had risen to 26 days and is higher by about 1 day against last year.
Takeaway: Wholesale used-vehicle sales slowed marginally against the gain in the pace of supply through the first half of May but are now following seasonally normal trends.
View historical MUVVI reports here.
For more information on Manheim, visit Manheim.com.
The Manheim Used Vehicle Value Index (MUVVI) is a trusted benchmark for tracking wholesale used-vehicle prices in the U.S., which helps dealers and analysts gauge market shifts and anticipate retail trends. The official measure is reported on the fifth business day of each month. The mid-month MUVVI number is a checkpoint number, is not an official reading and should not be compared to the official index reading. The mid-month is not a flash estimate, and it is not meant to provide any directional estimate of what the full month number will be. The next complete suite of monthly MUVVI data will be released on June 5, 2026.
For questions or to request data, please email manheim.data@coxautoinc.com. If you want updates about the Manheim Used Vehicle Value Index, as well as direct invitations to the quarterly call sent to you, please sign up for our Cox Automotive newsletter and select Manheim Used Vehicle Value Index quarterly calls.
Note: The Manheim Used Vehicle Value Index was adjusted to improve accuracy and consistency across the data set as of the January 2023 data release. The starting point for the MUVVI was adjusted from January 1995 to January 1997. The index was then recalculated with January 1997 = 100, whereas prior reports had 1995 as the baseline of 100. All monthly and yearly percent changes since January 2015 are identical. Learn more about the decision to rebase the index.