Key Metrics
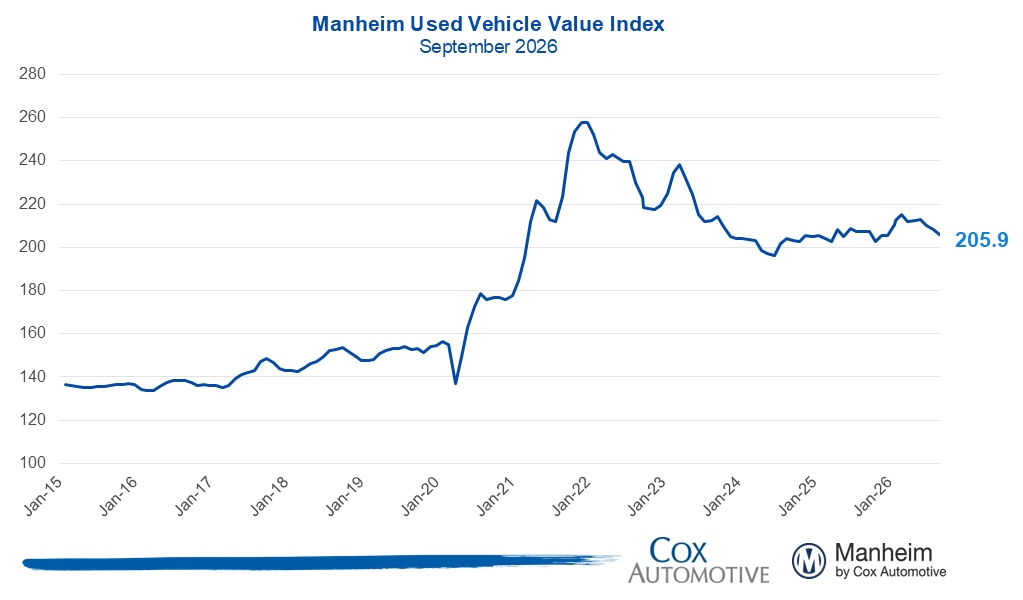
- The Manheim Used Vehicle Value Index (MUVVI) in September was 205.9, reflecting a 0.6% decrease for wholesale used-vehicle prices (adjusted for mix, mileage, and seasonality) compared to September 2025. The index is down 1.1% month over month. The long-term average monthly move for September is an increase of 0.3%.
- Non-adjusted wholesale vehicle prices are now down 1.2% year over year, and down 1.3% against August. The long-term average monthly move in non-adjusted values for September is a decrease of 0.3%.
Expert Perspective — Jeremy Robb, Chief Economist, Cox Automotive
“We are in the weakest season for wholesale valuations, and as September closed, depreciation was steeper than we typically see this time of year. The first half of the year actually showed more appreciation than usual, even in the face of higher fuel prices. But with the conflict in the Middle East ongoing, diesel prices at record highs, and interest rates climbing rapidly — increasingly worrying both businesses and consumers — wholesale prices have felt the sting.
The high cost of fuel is beginning to show up in the Manheim data. Diesel represents a small share of all units on the ground — just over 3% — but we’re seeing a clear downward effect on valuations as diesel prices hit all-time highs, and days’ supply for those vehicles is rapidly rising. Meanwhile, EV days’ supply has fallen, as sustained high gas prices push more consumers toward fuel-efficient used vehicles.
One further observation: We just had the first September without a hurricane in the Atlantic in decades. Those storms typically provide a bump in used-vehicle demand that softens depreciation. With no hurricane this year, that bump wasn’t there, which may partly explain why depreciation ran hotter than normal.
As we enter Q4, interest rates are rising, consumer sentiment is falling, and yet a wealth effect from strong and sustained financial-asset growth is providing some offsetting cushion. Many metrics we watch are converging back toward pre-pandemic norms, but the road to get there has been anything but smooth.”
Prices, Retention & Sales Conversion
- MMR prices for the Three-Year-Old Index decreased 1.7% in September.
- MMR retention averaged 99.3%, up 0.3 percentage points year over year and down 0.2 percentage points from August.
- Sales conversion was 55.2% for the period, 1.9 percentage points lower than the most recent three-year average for September and down 1.1 percentage points from the August rate.
Takeaway: MMR prices for the Three-Year-Old Index decreased more than the typical depreciation of 1.5% for this period. MMR retention decreased less than usual in the month of September. Meanwhile, sales conversion remains lower than usual for this time of year.
Segment Performance: Year-Over-Year Price Changes
Overall market prices were down slightly from a year ago, with strength among EVs and Compact Cars more than offset by Midsize Cars, Pickups and SUVs that continue to trend down.
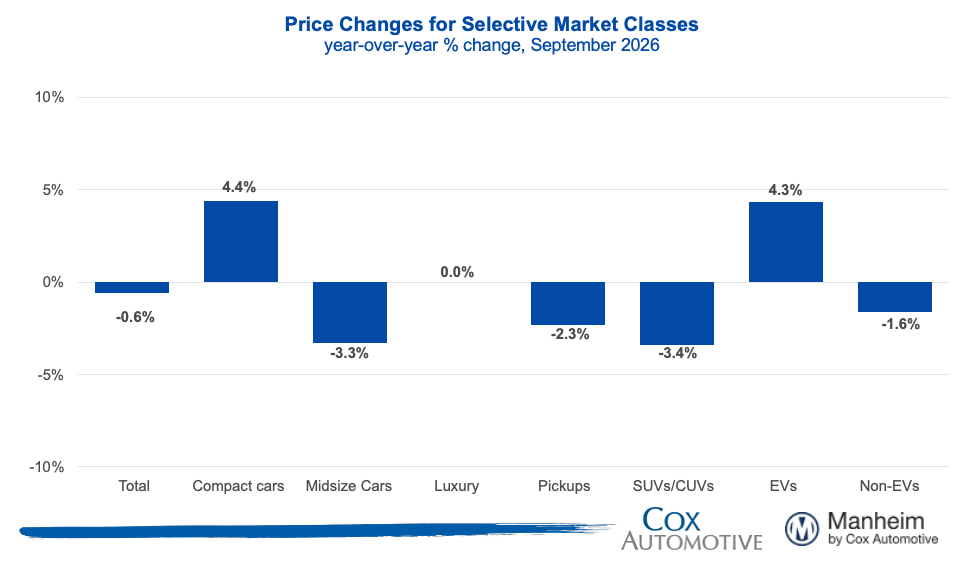
Takeaway: EVs and Compact Cars continue to show resilience as gas prices remain elevated.
EV versus Non-EV Index
- EVs: The Electric Vehicle (EV) Index was up 4.3% year over year and up 0.6% from August.
- Non-EVs: The Non-EV Index was down 1.6% year over year and down 1.7% from August.
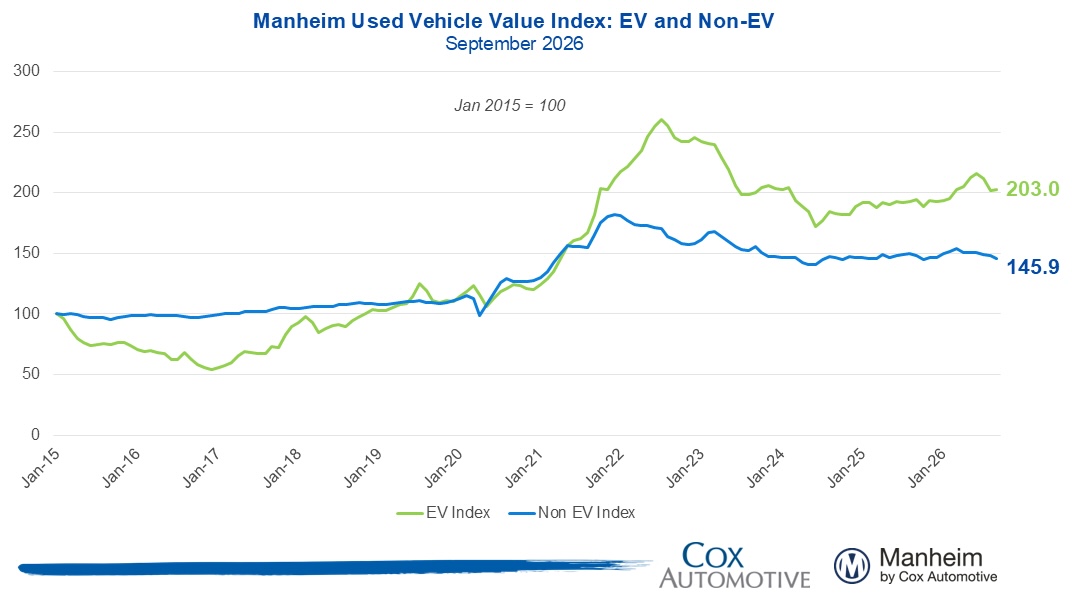
Takeaway: Non-EVs continued to decline in the past month, while EVs were mostly steady and remain above year-ago levels.
Wholesale Supply & Rental Prices
- Wholesale supply: At the end of September, wholesale days’ supply was 28, up 2.4 days year over year and down 1.1 days from August.
- Rental prices: Prices for rental vehicles were 4.2% higher year over year in September, down 2.2% from August. Rental values on a non-seasonally adjusted basis are 3.3% above 2025’s level and decreased 3.8% from August, consistent with lower average mileage, down 13.4% against last September.
Takeaway: Days’ supply in September was elevated against last year but remains within seasonal norms.
View historical MUVVI reports here.
For more information on Manheim: VISIT MANHEIM.COM
The Manheim Used Vehicle Value Index (MUVVI) is a trusted benchmark for tracking wholesale used-vehicle prices in the U.S., which helps dealers and analysts gauge market shifts and anticipate retail trends. The official measure is reported on the fifth business day of each month. The next complete suite of monthly MUVVI data will be released on Nov. 6, 2026.
Cox Automotive has transitioned the quarterly Manheim Used Vehicle Value Index Call from a scheduled live event to a prerecorded, on-demand content release. The Q3 2026 MUVVI Update and its supporting materials are available. See content release.
For questions or to request data, please email manheim.data@coxautoinc.com. If you want updates about the Manheim Used Vehicle Value Index, as well as direct communications on the quarterly updates, sign up for the Cox Automotive newsletter and select Manheim Used Vehicle Value Index quarterly updates.
Note: The Manheim Used Vehicle Value Index was adjusted to improve accuracy and consistency across the data set as of the January 2023 data release. The starting point for the MUVVI was adjusted from January 1995 to January 1997. The index was then recalculated with January 1997 = 100, whereas prior reports had 1995 as the baseline of 100. All monthly and yearly percent changes since January 2015 are identical. Learn more about the decision to rebase the index.