
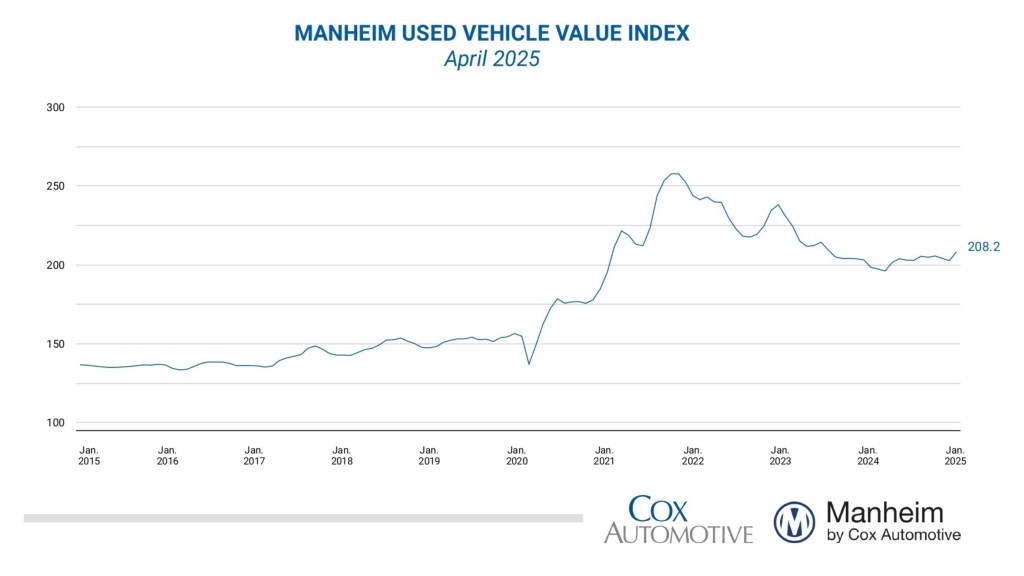
Wholesale used-vehicle prices (on a mix, mileage, and seasonally adjusted basis) were much higher in April compared to March. The Manheim Used Vehicle Value Index (MUVVI) increased to 208.2, an increase of 4.9% from a year ago and also higher than March levels by 2.7%. This is the highest reading for the index since October 2023. The seasonal adjustment dampened the rise seen in the month, as non-seasonally adjusted values increased sharply on the back of the tariff announcement in early April. The non-adjusted price in April increased by 3.3% compared to March, moving the unadjusted average price up 4.3% year over year.
“The ‘spring bounce’ normally ends the second week of April, but this year, wholesale appreciation trends continued for the entire month and were much stronger than we typically observe,” said Jeremy Robb, senior director of Economic and Industry Insights at Cox Automotive. “We expected to see strong price appreciation in response to the tariffs, and that’s exactly what came. Weekly trends showed higher values as we moved through the month, but those increases tapered off each successive week. Used retail sales remain stronger than normal, and wholesale days’ supply is a bit tighter, so we will likely see less depreciation than normal over Q2. As we move into the second half of the year, though, the auto market may slow as strong demand likely pulled some transactions forward in March and April as buyers tried to get ahead of expected higher prices due to tariffs.”
In April, Manheim Market Report (MMR) values saw price increases for each week in the month, save for the last week of April. In that final week, we finally saw prices decline week over week, though the price declines were not as rapid as usual. Over the last five weeks, the Three-Year-Old Index increased an aggregate of 2.6%, which is much higher than normally seen over the month. Those same weeks delivered an average decrease of 0.8% between 2014 and 2019, indicating appreciation trends were much stronger than usual, driven mostly by the tariff announcement.
Over the month, daily MMR Retention, which is the average difference in price relative to the current MMR, averaged 100.2%, meaning market prices held above MMR values this month but were a bit lower against March levels. Compared to last year, valuation models were up by 0.9 percentage points (90 basis points) for MMR retention, three-tenths of a point higher than 2019 levels for the same period. The average daily sales conversion rate in April was 63.7%, a decline against March but higher than we normally see at this time of year. For comparison, the daily sales conversion rate averaged 58.6% in April over the last three years.
Major market segments were mostly higher for seasonally adjusted prices year over year in April, except for the compact car segment. Compared to April 2024, the luxury segment rose the most for the third month in a row, increasing by 5.9%, with SUVs coming in the second highest as they rose by 5.5% over the last year. Underperforming the industry, trucks increased by 2.5%, mid-size sedans were higher by 0.8%, and compact cars showed the worst performance again, falling by 1.5% against last year. Compared to the previous month, SUVs performed best, moving higher by 2.4%, trucks were higher by 2.1%, and mid-size sedans increased by 2.2%. The luxury segment also rose but at a lower rate, increasing by 1.5% against March, and compact cars were higher by only 0.8% month over month.

Looking at the market by powertrain, electric vehicles (EVs) are now up against last year, right as the EV share of all units sold at Manheim hit the highest level on record, at 3.4% of all units. EV values were higher by 2.2% against March 2025, while non-EVs showed slightly higher gains and rose by 2.5%. For April 2025, EV values are now higher by 1.6% against April 2024, while non-EVs are up 4.7% year over year, just under the overall industry average. This is the first year-over-year gain in the EV index since March 2023.
Retail Used-Vehicle Sales Were Down in April
Assessing retail vehicle sales based on observed changes in units tracked by vAuto, initial estimates of retail used-vehicle sales in April were down 1.7% compared to March but higher year over year by 13%. Over the last four weeks, the average retail listing price for a used vehicle increased by 2%.
Using estimates of retail used days’ supply based on vAuto data, an initial assessment indicates April ended at 41 days’ supply, up one day from 40 days at the end of March and down five days from April 2024 at 46 days.
New-vehicle sales in April were higher by 11.1% from last year as tariff worries juiced sales, but volume declined 8% from an even stronger March. The April sales pace, or seasonally adjusted annual rate (SAAR), came in at 17.3 million, up 1.3 million from last year’s pace but lower than the 17.8 million level in March.
Combined sales into large rental, commercial, and government fleets increased 2.6% year over year in April, driven by an increase in rental fleet sales. Including an estimate for fleet deliveries into dealer and manufacturer channels, the remaining new retail sales were estimated to be up 14.8% from last year, a strong increase that pushed the estimated retail SAAR to 14.7 million, up 13.7% from last year’s pace, but down from March’s estimated 15.2 million level. Fleet share was estimated to be 15.0%, down from last year’s 17.7% share.
Rental Risk Price and Mileage Results Were Mixed Against Last April
The average price for rental risk units sold at auction in April increased 8.1% year over year. Additionally, rental risk prices rose by 4.1% compared to March, the largest monthly gain since early 2023. Average mileage for rental risk units in April (at 49,300 miles) fell 14.7% for the month against last year’s level, and rental fleet age is returning to pre-pandemic levels. For the month of April, rental unit average mileage was 1.2% lower than in March 2025.
Measures of Consumer Confidence Declined in April
The Conference Board Consumer Confidence Index® declined 8.4% in April, which was worse than expected; but March’s index was revised higher. Consumers’ views of the present and expectations declined, with expectations falling to the lowest level since 2009. Consumer confidence was down 11.8% year over year. Plans to purchase a vehicle in the next six months declined modestly to the lowest level since October 2023. The sentiment index from the University of Michigan declined 8.4% in April to 52.2, which was higher than expected and marked a smaller decline than the earlier reading at the beginning of the month. With the final monthly decline, the index is down 32% year over year to the lowest level since July 2022. The underlying views of current conditions and future expectations declined, with expectations falling the most. Expectations for inflation in one year increased to 6.5% from 5.0%, and expectations for inflation in five years increased to 4.4% from 4.1%. Consumers’ views of buying conditions for vehicles declined to the lowest level since September 2022 as views of prices deteriorated, but views of interest rates improved slightly. The daily index of consumer sentiment from Morning Consult declined 2.0% in April, adding to the 3.9% decline in March. The index ended the month up just 1.4% year over year. According to AAA, the national average price for unleaded gas decreased to $3.19 per gallon, down 1 cent in April from the end of March, which was down 13% year over year but up 4.0% year to date.
The next complete suite of monthly MUVVI data will be released on June 6, 2025.
For questions or to request data, please email manheim.data@coxautoinc.com. If you want updates about the Manheim Used Vehicle Value Index, as well as direct invitations to the quarterly call sent to you, please sign up for our Cox Automotive newsletter and select Manheim Used Vehicle Value Index quarterly calls.
Note: The Manheim Used Vehicle Value Index was adjusted to improve accuracy and consistency across the data set as of the January 2023 data release. The starting point for the MUVVI was adjusted from January 1995 to January 1997. The index was then recalculated with January 1997 = 100, whereas prior reports had 1995 as the baseline of 100. All monthly and yearly percent changes since January 2015 are identical. Learn more about the decision to rebase the index.


