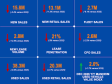
Wholesale used-vehicle prices (on a mix, mileage, and seasonally adjusted basis) were flat in August compared to July. The Manheim Used Vehicle Value Index (MUVVI) was unchanged at 207.4, representing a 1.7% increase from the same period last year. The seasonal adjustment softened the results for the month, as non-seasonally adjusted values increased more than typically seen for the month. The non-adjusted price in August increased by 1.0% compared to July, which now makes the unadjusted average price 1.8% higher year over year. The long-term move on average for non-seasonally adjusted values is a rise of 0.1% in August, demonstrating that last month’s unadjusted gains were larger than typically seen.
“Changes in wholesale values have continued to defy gravity a bit this year, as the industry suffers from lower used-vehicle inventory levels and increased demand from consumers for affordable vehicles,” said Jeremy Robb, deputy chief economist for Cox Automotive. “As we’ve seen volatility in recent months, the Manheim index is lower than the April peak, but still a few points higher than March levels. New-vehicle sales have remained strong through August, and as that continues, it drives more consumer demand in the used market as well. As we move toward the end of Q3 when EV incentives are set to expire, new and used EV sales have remained robust. This increased demand has elevated values for used EVs at auction, making the EV segment the strongest performer currently against last year for wholesale values.”
In August, Manheim Market Report (MMR) values showed no change over the month, with valuations fluctuating by approximately 0.1% each week in the month. Over the last five weeks, the Three-Year-Old Index decreased an aggregate of 0%, less than is usually seen. Those same weeks delivered an average decrease of 0.6% between 2014 and 2019, indicating depreciation trends were more muted for the month overall. Trends for 3-year-old MMR levels last month were lower than the gain of 1.6% seen in August last year, as wholesale values a year ago were increasing more than normally seen during that period.
Over the month, daily MMR Retention, which is the average difference in price relative to the current MMR, averaged 99.8%, meaning market prices stayed below MMR values this month; but they were higher than July levels by 0.6%. Compared to last year, valuation models for MMR retention remained unchanged, although they are higher than the August levels seen in 2022 and 2023. The average daily sales conversion rate rose to 61.9% in August, an increase of almost 6 points against the prior month and higher than normally seen at this time of year. For comparison, the daily sales conversion rate averaged 56.4% in August over the previous three years, showing that sales conversion is holding higher than usual.
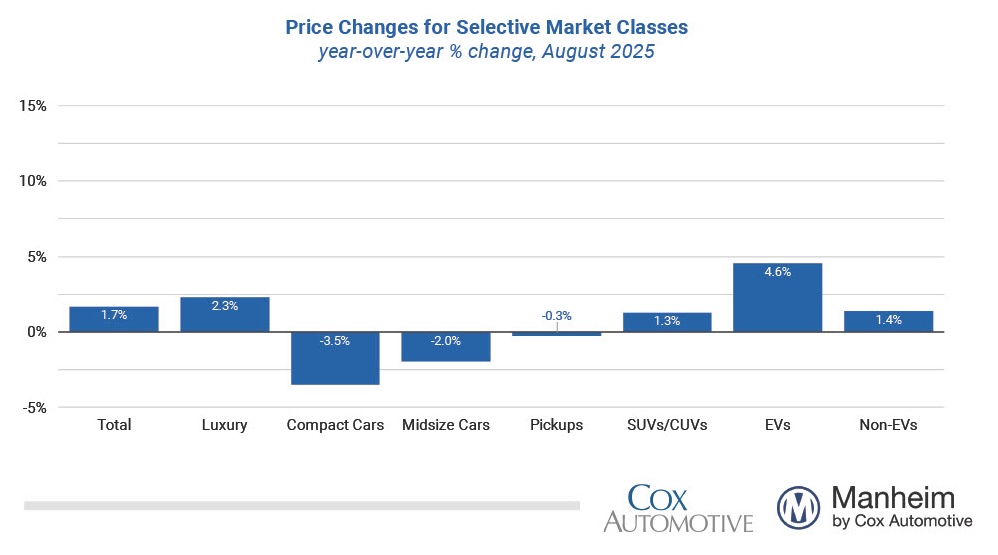
Major market segments were mixed for seasonally adjusted prices year over year in August. Compared to August 2024, the luxury segment rose the most again, increasing by 2.3%, with SUVs also higher by 1.3% over the last year, although this is below the industry average 1.7%. Performing below the industry average, trucks were down by 0.3%, while mid-size sedans declined 2.0%, and compact cars fell the most, down 3.5% compared to last year. Major market segments were also mixed compared to the previous month, with compact cars increasing by 1.2%, mid-size sedans up by 0.7%, and SUVs higher by just 0.1%. The pickup segment declined by 0.4% compared to July, and the luxury segment fell by 0.8% during the period.
Looking at the market by powertrain, electric vehicle (EVs) values still show larger gains against last year than the market overall, which continues to be partially driven by depressed values in the comparison period. Wholesale EV values showed strong declines in the second half of 2023 and first half of 2024, making the current year-over-year gains in valuation more pronounced. EV values have shown higher year-over-year appreciation trends for the last five consecutive months and were 4.6% higher than the same month in 2024, while non-EVs rose by 1.4%. For August results compared to July, EV values increased more than non-EVs, up by 0.8% against the prior month, while non-EVs were higher by 0.7%.
Retail Used-Vehicle Sales Were Up in August
Assessing retail vehicle sales based on observed changes in units tracked by vAuto, initial estimates of retail used-vehicle sales in August were up 9.2% compared to July and up year over year by 9%. The average retail listing price for a used vehicle increased 0.3% over the last four weeks.
Using estimates of retail used days’ supply based on vAuto data, an initial assessment indicates August ended at 42 days’ supply, down four days from 46 days at the end of July and down two days from August 2024 at 44 days.
New-vehicle sales in August increased 6.2% from last year, and volume also increased from July, rising 5.3%. The August sales pace, or seasonally adjusted annual rate (SAAR), came in at a healthy 16.1 million, up 1.0 million from last year’s pace but below the very strong 16.5 million level in July.
Combined sales into large rental, commercial, and government fleets rose sharply, up 29.4% year over year in August. This increase was led by gains in the rental sector and was partially driven by a weak comparison from last August, as we continue to observe weakness in government fleet sales. Including an estimate for fleet deliveries into dealer and manufacturer channels, the remaining new retail sales were estimated to be up 2.5% from last year, leading to an estimated retail SAAR of 13.7 million, up from 13.1 million last August but down slightly from July’s estimated 13.8 million level. Fleet share was estimated to be 13.8%, up from last year’s 13.4% share.
Rental Risk Price and Mileage Results Remained Mixed Against Last August
The average price for rental risk units sold at auction in August increased 4.7% year over year. Additionally, rental risk prices were up by 2.4% compared to July. Average mileage for rental risk units in August (at 49,300 miles) declined by 9.8% for the month against last August’s level but was higher against the July comparison, rising by 2.3% over the month.
Measures of Consumer Confidence Showed Mixed Trends in August
The Conference Board Consumer Confidence Index® decreased 1.3% in August but was better than expected as July was revised up. Consumers’ views of both the present and the future declined similarly. Consumer confidence was down 7.8% year over year. Plans to purchase a vehicle in the next six months increased and were higher year over year. The sentiment index from the University of Michigan decreased 5.7% in August to 58.2, which was lower than expected and marked a decrease from the earlier reading at the beginning of the month. The index was down 14.3% year over year. The underlying views of both current conditions and future expectations declined, with current conditions declining the most. Expectations for inflation in one year increased to 4.8% from 4.5%, and expectations for inflation in five years increased to 3.5% from 3.4%. Consumers’ views of buying conditions for vehicles declined to the lowest level in three months as views of both prices and interest rates deteriorated. The daily index of consumer sentiment from Morning Consult increased 0.6% in August, with improvement on most days in the final two weeks of the month, leaving the index up 4.6% year over year. According to AAA, the national average price for unleaded gas increased 4 cents in August from the end of July to $3.19 per gallon, which was down 4% year over year but up 4.2% year to date.
The next complete suite of monthly MUVVI data will be released on Oct. 7, 2025. The Q3 MUVVI call will be held on Oct. 7 at 11 a.m. EDT. Register to attend. The presentation will be available for download one hour before the call.
For questions or to request data, please email manheim.data@coxautoinc.com. If you want updates about the Manheim Used Vehicle Value Index, as well as direct invitations to the quarterly call sent to you, please sign up for our Cox Automotive newsletter and select Manheim Used Vehicle Value Index quarterly calls.
Note: The Manheim Used Vehicle Value Index was adjusted to improve accuracy and consistency across the data set as of the January 2023 data release. The starting point for the MUVVI was adjusted from January 1995 to January 1997. The index was then recalculated with January 1997 = 100, whereas prior reports had 1995 as the baseline of 100. All monthly and yearly percent changes since January 2015 are identical. Learn more about the decision to rebase the index.