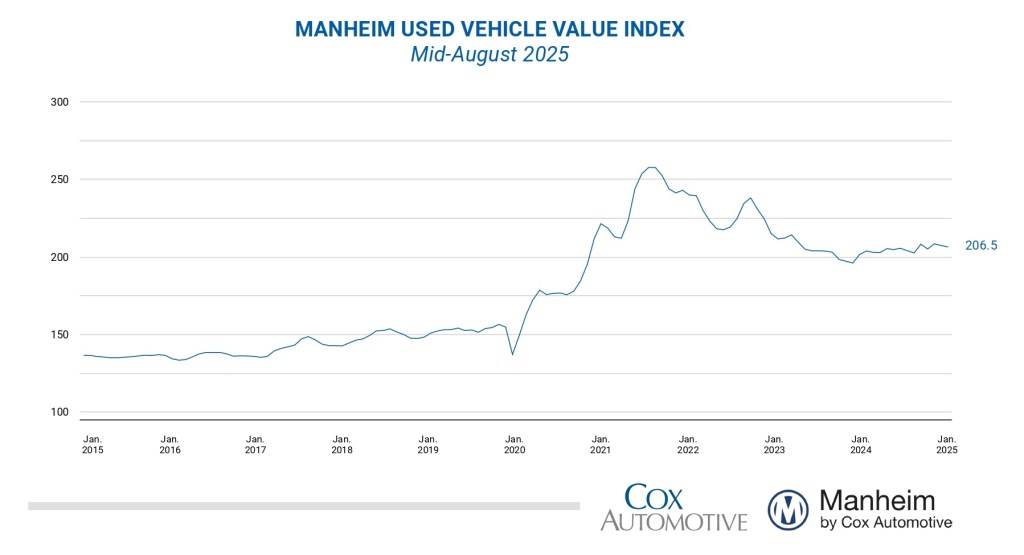
Wholesale used-vehicle prices (on a mix-, mileage-, and seasonally adjusted basis) decreased from July in the first 15 days of August. The mid-month Manheim Used Vehicle Value Index fell to 206.5, showing a rise of only 1.2% from the full month of August 2024. The seasonal adjustment was responsible for the decline in the index in the month, as it was higher than typically seen. The non-adjusted price change in the first half of August rose 0.6% compared to July, and the unadjusted price is higher by 1.3% year over year. The average move for the full month of August is a small rise of 0.1 percentage points for non-adjusted values, indicating the pricing moves observed so far in August are stronger than normally seen for the full month. August 2024 showed abnormally strong price appreciation, making the comparison more difficult on a year-over-year basis.
“We started to see stronger sales trends in late July and early August for retail and wholesale markets, and that’s causing some additional volatility in wholesale pricing trends in recent weeks, against a stronger comparison from last year,” said Jeremy Robb, senior director of Economic and Industry Insights at Cox Automotive. “In the first two weeks of August, non-seasonally adjusted prices are appreciating more than usual, though the seasonal adjustment was a bit stronger, causing the index to decline at the mid-month point. Used retail supply has further tightened in recent weeks to the tightest level since early April, and that is keeping buyers active at Manheim to replenish inventory. While the tariffs induced much volatility in the automotive market earlier this year, we still see solid demand for both retail and wholesale vehicles.”
Over the last two weeks, the Manheim Market Report (MMR) prices for the Three-Year-Old Index showed no change overall, as values fell in the first week of August and rose in the second. The long-term average decline for 3-year-old values in the first two weeks of August is a decline of 0.3%. Over the first 15 days of August, MMR Retention, the average difference in price relative to current MMR, averaged 99.8%, showing stronger pricing trends over the first half of the month. This is a rise of 0.6 points from late July, indicating that market prices moved closer to valuation models early in August. MMR retention is flat compared to the first half of August 2024, another period when demand was elevated at Manheim. The average daily sales conversion rate of 61.8% in the first half of the month was half a point lower than last year’s level of 62.3%, but over 5 points higher than the end of July.

Results by segment for seasonally adjusted prices year over year in the first half of August were mixed. Compared to the industry’s year-over-year increase of 1.2%, the luxury segment performed best, rising by 1.8%, slightly higher than the market. Rising less than the industry, SUVs were higher by 0.9%. Trucks declined 0.6%, mid-size cars fell by 2.0%, and the compact car segment declined the most again, lower by 3.8% against last year. Against the full month of July, results by segment varied. The overall industry fell by 0.4% against the preceding month, though compact and mid-size cars were higher over the period, rising by 0.9% and 0.7%, respectively. The SUV segment was down 0.3% against July, with trucks falling by 0.7%, and luxury falling the most, down 1.4% since the end of last month.
Electric vehicles (EVs) are showing the strongest year-over-year gains currently, as demand rises for these units with the impending end of tax credits next month. EVs showed an increase of 4.2% in early August, while the non-EV segment increased by just 0.9% over the period. Against July values, EVs showed larger gains than the industry, rising by 0.5% in the first half of August, while non-EVs were higher by 0.3% against July in the first half of the month.
Wholesale Supply Is Down in Mid-August
Leveraging Manheim sales and inventory data, wholesale supply ended July at an estimated 26 days, showing no change against the end of June and down one day compared to July 2024. Wholesale supply remains tighter at this time of year, running roughly two days lower than the longer-term levels for this week. As of Aug. 15, wholesale supply had fallen one day from the end of July, at 25 days, and was 3% or one day lower than last year.
Consumer Sentiment Lower in First Half of August
The initial reading in August of the sentiment index from the University of Michigan showed a decline of 5.0% from July and was lower than analysts’ expectations. With the decline, the index was down 13.7% year over year. Views of both current conditions and expectations declined, but current conditions declined the most. Expectations for inflation in one year increased to 4.9% from 4.5%, and expectations for inflation in five years increased to 3.9% from 3.4%. Consumers’ views of buying conditions for vehicles decreased to the lowest level since May and were worse than one year ago, as both views of interest rates and views of car prices deteriorated. The daily index of consumer sentiment from Morning Consult shows a downward trend with data through Aug. 15. After increasing 1.3% throughout July, the index has reversed course and is down 1.3% so far in August. Views of both current conditions and future expectations declined in the first half of August, but views of future expectations declined the most. According to AAA, the average price of unleaded gasoline has decreased 0.3% for the month as of Aug. 15 to $3.14 per gallon, which was down 8% year over year but up 2.6% year to date.
The next complete suite of monthly MUVVI data will be released on Sept. 8, 2025, the fifth business day of the month, as regularly scheduled.
For questions or to request data, please email manheim.data@coxautoinc.com. If you want updates about the Manheim Used Vehicle Value Index, as well as direct invitations to the quarterly call sent to you, please sign up for our Cox Automotive newsletter and select Manheim Used Vehicle Value Index quarterly calls.
Note: The Manheim Used Vehicle Value Index was adjusted to improve accuracy and consistency across the data set as of the January 2023 data release. The starting point for the MUVVI was adjusted from January 1995 to January 1997. The index was then recalculated with January 1997 = 100, whereas prior reports had 1995 as the baseline of 100. All monthly and yearly percent changes since January 2015 are identical. Learn more about the decision to rebase the index.