
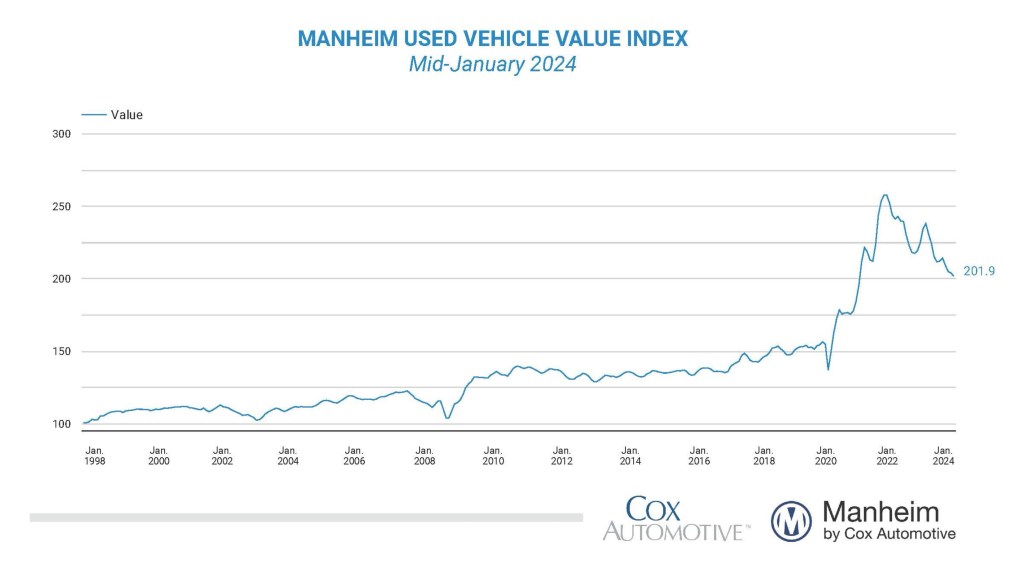
Wholesale used-vehicle prices (on a mix-, mileage-, and seasonally adjusted basis) decreased 1.0% from December in the first 15 days of January. The midmonth Manheim Used Vehicle Value Index dropped to 201.9, which was down 10.2% from the full month of January 2023. The seasonal adjustment minimally added to the decline. The non-adjusted price change in the first half of January dropped 0.9% compared to December, while the unadjusted price was down 9.9% year over year.
Over the last two weeks, Manheim Market Report (MMR) prices declined an aggregate of 0.7%, which was more than the normal decline of 0.1% for the time of year. Over the first 15 days of January, MMR Retention, the average difference in price relative to current MMR, averaged 99.6%, indicating that valuation models are close to market prices. The average daily sales conversion rate of 56.3% in the first half of the month was below the January 2019 daily average of 57.7%. The conversion rate indicates that the first 15 days of the month saw weaker-than-normal buying demand for this time of year.
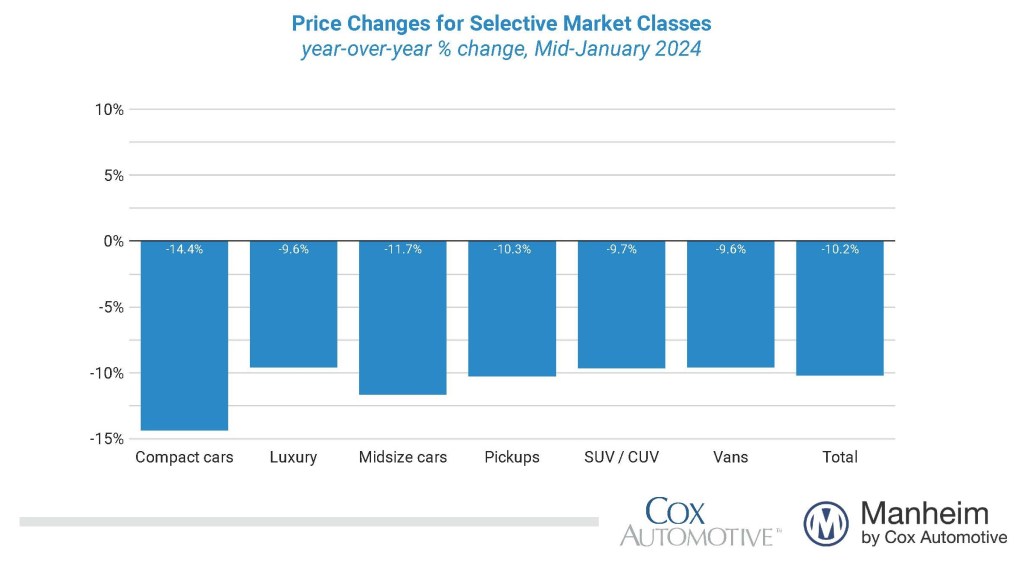
All major market segments saw seasonally adjusted prices that remained lower year over year in the first half of January. Compared to the industry’s year-over-year decline of 10.2%, SUVs lost less at 9.7%, while luxury and vans both lost 9.6%. Faring worse than the industry, compact cars were down 14.4%, midsize cars were off by 11.7%, and pickups lost 10.3% year over year. All major segments saw negative price performance compared to December, with luxury, SUVs, and compact cars down 1.4%, 1.3 %, and 1.1%, respectively, worse than the 1.0% decline for the industry. Midsize cars lost 0.8%, pickups were down 0.6%, and vans lost 0.3%, all better than the industry.
Wholesale Supply Is up in Mid-January
Leveraging Manheim sales and inventory data, we estimate that wholesale supply ended December at 32 days, up two days from the end of November and up one day year over year. As of Jan. 15, wholesale supply was up one day from the end of December at 33 days, and up two days year over year but down two days compared to 2019. Wholesale supply is tighter than normal for this time of year.
Rental Risk Prices Declined in First Two Weeks of January
The average price for rental risk units sold at auction in the first 15 days of January was down 7.3% year over year. Rental risk prices were down by 2.4% compared to the full month of December. Average mileage for rental risk units in the first half of December (at 43,500 miles) was down 22.5% compared to a year ago and down 2.1% month over month.
Consumer Sentiment Down So Far in January
The daily index of consumer sentiment from Morning Consult was challenged last summer and fall; but it ended 2023 with positive momentum, increasing 5.6% in December. January is off to a negative start as the index had a rough end of last week and beginning of this week and is now down 1.2% so far in January but up 9.9% year over year. Sentiment has declined in January as gas prices have declined to new multi-year lows. The average unleaded gas price has declined 1.2% so far in January to $3.07 per gallon as of Sunday, which was down 7% year over year and at the lowest price since June 2021.
The complete suite of monthly MUVVI data for January will be released on Feb. 7, 2024, the fifth business day of the month, as regularly scheduled.
For questions or to request data, please email manheim.data@coxautoinc.com. If you want updates about the Manheim Used Vehicle Value Index, as well as direct invitations to the quarterly call sent to you, please sign up for our Cox Automotive newsletter and select Manheim Used Vehicle Value Index quarterly calls.
Note: The Manheim Used Vehicle Value Index was adjusted to improve accuracy and consistency across the data set as of the January 2023 data release. The starting point for the MUVVI was adjusted from January 1995 to January 1997. The index was then recalculated with January 1997 = 100, whereas prior reports had 1995 as the baseline of 100. All monthly and yearly percent changes since January 2015 are identical. Learn more about the decision to rebase the index.


