Wholesale used-vehicle prices (on a mix-, mileage-, and seasonally adjusted basis) declined from April in the first 15 days of May. The mid-month Manheim Used Vehicle Value Index fell to 205.9, showing a rise of 4.4% from the full month of May 2024. The seasonal adjustment lowered the reading of the index for the month, as it was stronger than usual. The non-adjusted price change in the first half of May decreased by 1.1% compared to April, and the unadjusted price is 4.3% higher year over year. The average move for the full month of May is a decline of 0.3 percentage points on non-adjusted values, indicating that the depreciation observed so far in May is stronger than usual, following very strong appreciation trends in April.
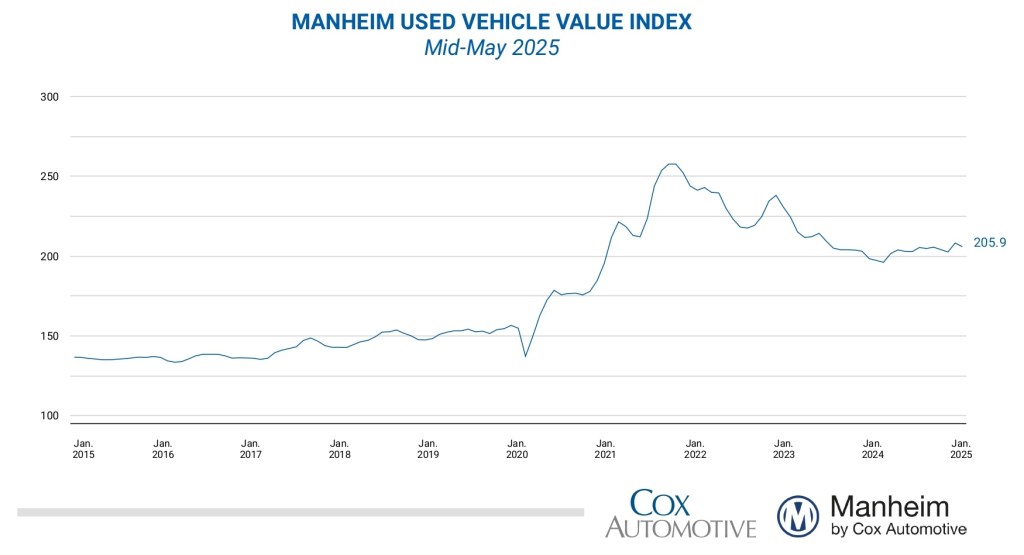
“April was a very strong month for wholesale price appreciation; but the gains decelerated each week over the course of the month, and that trend continued into early May,” said Jeremy Robb, senior director of Economic and Industry Insights at Cox Automotive. “In the first two weeks of May, we’ve seen fairly normal depreciation trends on a weekly basis, as used retail supply remains constrained. However, some of the strength in the pace of used sales has backed off, and days’ supply is getting slightly better. As the tariff situation evolves and the frenzy of buying activity for new vehicles calms down, we expect wholesale pricing trends to remain more normal through Q2.”
Over the last two weeks, the Manheim Market Report (MMR) prices in the Three-Year-Old Index decreased by an aggregate of 0.6%, actually showing less depreciation than normal and not falling as much as the overall index. The long-term average decrease for 3-year-old values in the first two weeks of May is 0.8%. Over the first 15 days of May, MMR Retention, the average difference in price relative to the current MMR, averaged 99.1%, indicating that market prices have moved slightly lower than valuation models early in May. MMR retention is 0.4 percentage points lower compared to the first half of May 2024. The average daily sales conversion rate of 59.3% in the first half of the month was almost 4 points higher than last year’s level of 55.5%, but it is slightly below the first half of May 2019 by six-tenths of a point.
Most major market segments saw positive results for seasonally adjusted prices year over year in the first half of May. Compared to the industry’s year-over-year increase of 4.4%, the luxury segment performed best, rising by 6.6%, and SUVs were higher by 5.5%. Rising less than the industry, mid-size cars were higher by 2.3%, and trucks were up 0.5%. The compact car segment was the only group to decline in the month, falling 1.2% against last year. All segments were lower compared with the results at the end of April. The overall industry decreased 1.1% against the prior month, and mid-size cars performed better, only down 0.5%, while luxury was down 0.7% and SUVs fell by 1.0%. The truck segment fell more than the industry, declining 1.7% against April, while compact cars were down 1.9%.

Electric vehicles (EVs) joined the other segments and were also higher on a year-over-year basis, rising by 2.0% against May 2024, while the non-EV segment was up more, showing a 4.2% gain over the period. Against April values, EVs declined by 2.0% in the first half of May, while non-EVs fell less and were down 1.5% in the month.
Wholesale Supply is Down in Mid-May
Leveraging Manheim sales and inventory data, wholesale supply ended April at an estimated 24 days, unchanged from the end of March and down one day compared to April 2024 (at 25 days). Wholesale supply continues to hold tighter at this time of year, running roughly one day lower than the longer-term levels for this week. As of May 15, wholesale supply had remained unchanged from the end of April, at 24 days, and was 4% or one day lower versus last year.
Measures of Consumer Sentiment Mixed in First Half of May
The initial May reading on Consumer Sentiment from the University of Michigan declined 2.7% to 50.8, which was a surprise decline when a small gain had been expected. The index was down 26.5% year over year. Views of both current conditions and expectations declined, but current conditions declined the most. Expectations for inflation in one year jumped to 7.3% from 6.5%, and expectations for inflation in five years increased to 4.6% from 4.4%. Consumers’ views of buying conditions for vehicles increased as views of prices improved and views of interest rates were steady. The daily index of consumer sentiment from Morning Consult shows a positive trend with data through May 15. After declining every month this year, the index is up 3.9% so far in May. Views of both current conditions and future expectations improved in the first half of May, but future expectations have improved the most. The average price of unleaded gasoline has increased 0.2% as of May 15 but is down 11% year over year.
The next complete suite of monthly MUVVI data will be released on June 6, 2025, the fifth business day of the month, as regularly scheduled.
For questions or to request data, please email manheim.data@coxautoinc.com. If you want updates about the Manheim Used Vehicle Value Index, as well as direct invitations to the quarterly call sent to you, please sign up for our Cox Automotive newsletter and select Manheim Used Vehicle Value Index quarterly calls.
Note: The Manheim Used Vehicle Value Index was adjusted to improve accuracy and consistency across the data set as of the January 2023 data release. The starting point for the MUVVI was adjusted from January 1995 to January 1997. The index was then recalculated with January 1997 = 100, whereas prior reports had 1995 as the baseline of 100. All monthly and yearly percent changes since January 2015 are identical. Learn more about the decision to rebase the index.