What Dealers Are Leaving in the Service Lane
Dealership service revenue is at an all-time high. So is the amount of money dealers are leaving on the table. New research from Cox Automotive reveals exactly where — and what the highest-performing dealers are doing differently.
April 9, 2026
8 min read
Buyers who return for service are nearly twice as likely to buy their next car from the same dealer.
74%
of buyers who returned for service are likely to repurchase from that dealership
44%
of those who didn’t.
Source: 2025 Cox Automotive Fixed Ops and Ownership Study
Chapter 1
Record Revenue, Shrinking Share
$9.23M
![]() 33% since 2018
33% since 2018
Average dealer service & parts revenue
29%
![]() 12% since 2018
12% since 2018
Dealer share of service visits
Revenue is up. Market share is down. The fixed ops top line is masking a structural shift.
Record Revenue, Shrinking Share
Dealership share of service visits by vehicle age:
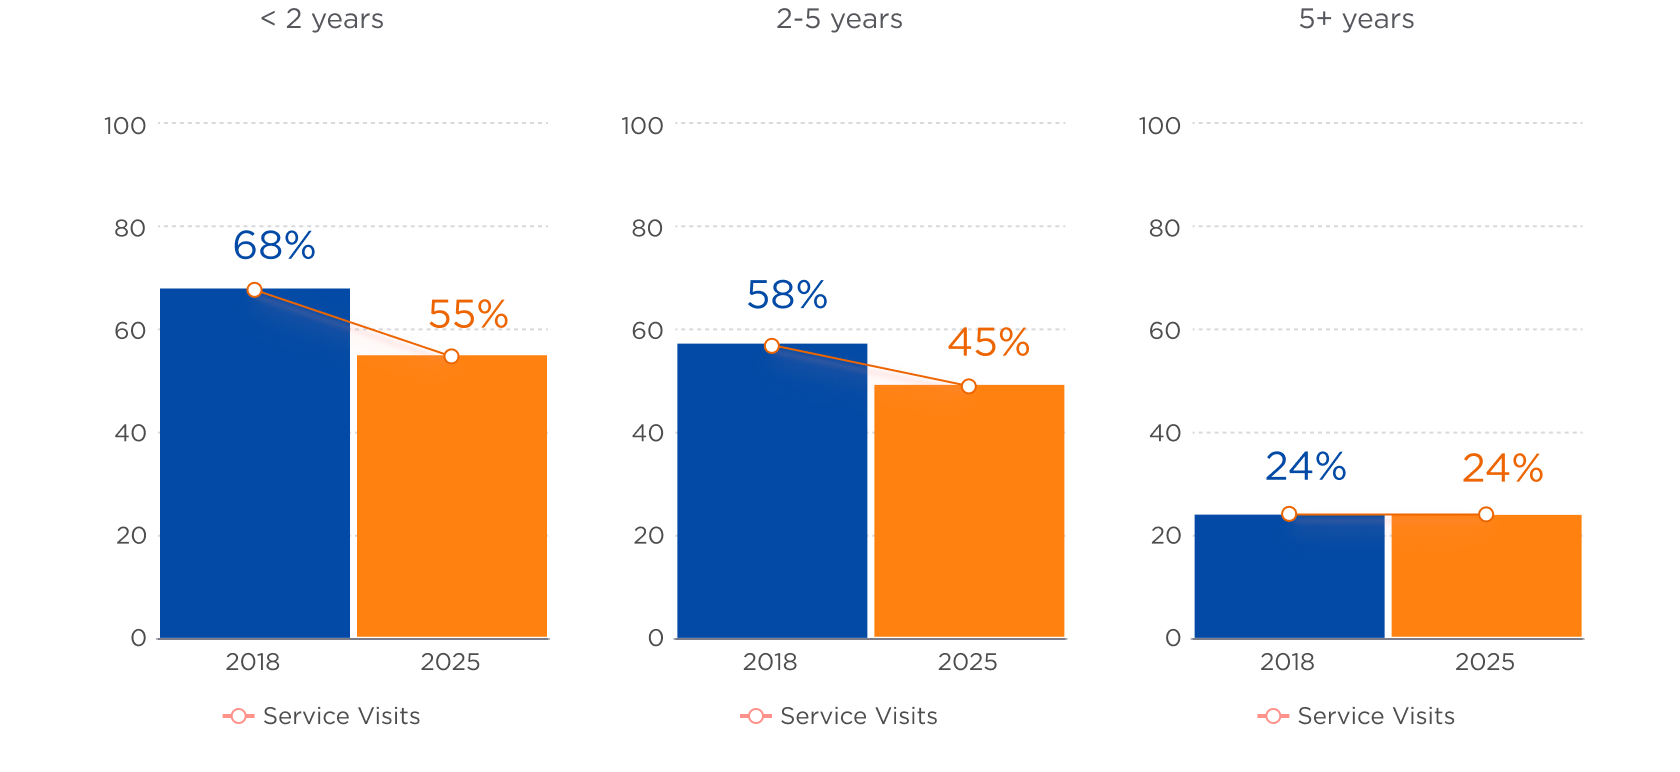
The sharpest losses are among the newest vehicles — the customers dealers should have the strongest
Where the Money Is Going
The gap between what dealers could capture and what they’re actually realizing shows up everywhere: in scheduling, in transparency, and in the service lane’s untapped value as an inventory pipeline.
80%
New buyers want to service at the selling dealership
30%
Have that first appointment
14%
Consumers that have been offered a trade-in value during a service visit
33%
Consumers that are Highly interested in a
$640
vs.
$410
per repair order spend
when dealers send photos and videos of recommended work vs. when they
But here’s what the data also shows: once a customer walks into a dealership service lane, 89% consider coming back. The retention engine works. The opportunity is getting more customers through that first door.

Your Move
The share is leaving, but the data says it doesn’t have to. Dealers who invest in trust, transparency, and the right technology are holding and growing their position.
Chapter 2
The Stickiness Advantage
89%
Consumers who service at a dealership consider coming back.
41%
Dealership
41%
General Repair
Before the first visit, there’s no built-in advantage. Dealerships and general repair shops start with equal consideration among consumers—41% each. The playing field is level.
89%
Dealership Retention
20%
Non-dealership Retention
But after that first service visit, everything changes. 89% of dealership service customers consider returning. Among consumers servicing elsewhere, only 20% consider switching to a dealership. The first visit is the tipping point.
#1: Trust
Over price, location, friendliness, etc.
What brings them back? Trust. It’s the number-one reason consumers return to a dealership for service—ahead of the deal they got on the vehicle, location, friendliness, and every other factor. That trust is built on expertise, vehicle history knowledge, warranty coverage, and transparency.
25%
Introduction rate
23%
Scheduling rate
Yet most dealers aren’t activating this advantage. Only 25% of buyers are introduced to the service department during the purchase. Only 23% have a first service appointment scheduled for them. The retention engine works—it’s just not being turned on.
Your Move
Win the first visit. Introduce every buyer to the service department before they leave the lot. Schedule that first appointment at point of sale. The data is clear: once they’re in, they stay.
Chapter 3
What High Performers Do Differently
58%
of high performers describe service profits as “strong”
vs.
28%
of others describe service profits as “strong”
Half of the dealers in this study became both more efficient and more profitable in the past year. They aren’t bigger. They aren’t in better markets. They operate differently: treating the service department as a strategic business unit connected to the rest of the dealership, not an isolated operation.
The differences show up across profitability, capacity, customer experience, and workforce stability.
Your Move
Start measuring. High performers are significantly more likely to track RO performance metrics closely (44% vs. 31%) and to have implemented service process efficiencies (42% vs. 24%). You can’t close a gap you aren’t tracking.
Chapter 4
Solving What Frustrates Your Customers
45%
of dealership service customers reported a frustration during their visit.
Solving What Frustrates Your Customers
Speed Frustration
24%
Offer Online Scheduling
81%
72%
Offer Mobile Check-in
21%
12%
High Performers
Others
Customer Frustration
“It took too long”
The number-one frustration, cited by 24% of those with a complaint. Speed and communication are what separate a good experience from a bad one—customers who rated their visit better than expected cited both. High performers are ahead: 81% offer online scheduling vs. 72% of others. 21% offer mobile check-in vs. 12%.
Tools Addressing Transparency
Pricing Opacity Frustration
13%
Price Exceeding Estimate Frustration
12%
Electronic Estimate Review and Approval
62%
50%
High Performers
Others
Customer Frustration
“I couldn’t find out what they charge.”
Pricing opacity is the second-biggest frustration (13%), and price exceeding the estimate is the fourth (12%). High performers close this gap with electronic estimate review and approval (62% vs. 50%). And consumers are arriving more informed than ever — 16% already used an AI tool to research their last service provider, with price comparison and identifying needed services as the top use cases.
16%
already used an AI tool to research their last service provider
Tools Addressing Trust
Upsell Frustration
13%
ROs with photos/videos ROs without
64%
48%
High Performers
Others
Customer Frustration
“They tried to push additional services.”
Thirteen percent of frustrated customers felt pushed on upsells. But when consumers can see their vehicle and the concern in the same photo or video, the dynamic shifts from skepticism to understanding. 65% of dealership servicers say photos and videos build trust with their provider. High performers are 16 points ahead on adoption: 64% vs. 48%.
65%
of dealership servicers say photos and videos build trust with their provider.
Dealers Who Share Photos and Videos See Higher ROs
Average out-of-pocket repair order spend when dealers share photos and videos of recommended repairs vs. when they don’t. A $230 difference per
Consumers Who Received Photos and Videos
49%
of consumers who received photos and videos are more likely to approve recommended
45%
are more likely to recommend the service department to
Your Move
Start with photo and video integration into multi-point inspections — it has the clearest ROI in the data. Then layer in online scheduling, electronic estimates, and mobile check-in. Match your tools to your customers’ frustrations, not the other way around.
Chapter 5
The Full-Picture Payoff
The service lane isn’t just a profit center. It’s the engine that powers the dealership — connecting retention to repurchase to inventory acquisition.
Stage 1:
Service drives repurchase.
74%
Buyers who returned for service are likely to repurchase from that dealer.
44%
Those who didn’t? Less than half will come back to buy.
Stage 2:
Service drives inventory acquisition.
14%
of consumers have been offered a trade-in value during a service visit.
33%
of consumers are highly interested
in a trade-in.
Service Repair Costs
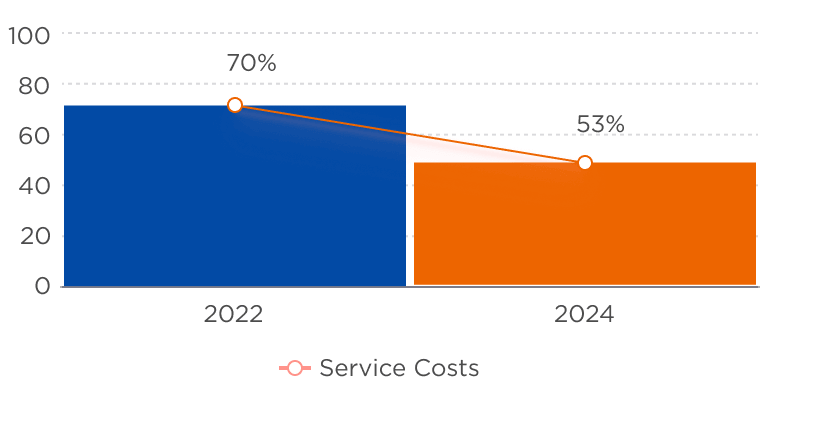
Consumers start considering a trade-in over repair at $3,195 in repair costs. And the trend is accelerating: in 2022, 70% of consumers facing high repair costs preferred to repair. By 2024, that dropped to 53%.
86%
of high performers have an established process for acquiring inventory through the service lane
72%
of others have an established process for acquiring inventory through the service lane
Your Move
Surface vehicle valuations during service visits — proactively, not just when the customer asks. Only 14% of consumers have been offered one, but a third want it. That’s your next sale and your next piece of inventory, already in the service lane.
Chapter 6
The Connected Dealership Advantage
The insights above point to gaps at every stage of the customer journey. Cox Automotive helps dealers close them — from the first service appointment to the next vehicle purchase.
What the Data Shows
How Cox Automotive Connects It
Discovery & Research
16% of consumers use AI to pre-research service options; dealerships and general repair start with near-equal consideration
Autotrader, Kelley Blue Book, and Dealer.com help dealers show up where consumers are already looking — with transparent pricing, reviews, and online scheduling before they ever call.
Purchase & Handoff
Only 25% of buyers are introduced to the service department;
Only 23% have a first appointment scheduled
Xtime Schedule integrates into the delivery process. VinSolutions CRM triggers automated post-sale service outreach for buyers who leave without booking.
Service Experience
$230 more per RO with photo/video;
45% of customers frustrated by speed, pricing opacity, or perceived upsells
Xtime Inspect powers the photo/video workflow behind the $230 lift. Xtime Engage handles online scheduling, mobile check-in, and electronic estimate approval.
Retention & Repurchase
74% of service returnees likely to repurchase
44% of service returnees who don’t repurchase
Trust is among the strongest repurchase motivators
VinSolutions connects service history to the CRM so salespeople can identify repurchase-ready customers. Autotrader and Kelley Blue Book surface personalized vehicle recommendations.
Inventory Acquisition
Only 14% offered a trade-in valuation in service
33% want to be offered a trade-in valuation in service;
$3,195 is the repair-vs-trade tipping point
vAuto gives service advisors real-time trade-in valuations at the moment of the repair estimate. Dealertrack DMS and Xtime share a single customer record so the conversation happens in the moment — without switching systems.
| Stage | What the Data Shows | How Cox Automotive Connects It |
|---|---|---|
| Discovery & Research | 16% of consumers use AI to pre-research service options; dealerships and general repair start with near-equal consideration | Autotrader, Kelley Blue Book, and Dealer.com help dealers show up where consumers are already looking — with transparent pricing, reviews, and online scheduling before they ever call. |
| Purchase & Handoff | Only 25% of buyers are introduced to the service department; only 23% have a first appointment scheduled | Xtime Schedule integrates into the delivery process. VinSolutions CRM triggers automated post-sale service outreach for buyers who leave without booking. |
| Service Experience | $230 more per RO with photo/video; 45% of customers frustrated by speed, pricing opacity, or perceived upsells | Xtime Inspect powers the photo/video workflow behind the $230 lift. Xtime Engage handles online scheduling, mobile check-in, and electronic estimate approval. |
| Retention & Repurchase | 74% of service returnees likely to repurchase vs. 44% who don’t; trust is among the strongest repurchase motivators. Trust is among the strongest repurchase motivators | VinSolutions connects service history to the CRM so salespeople can identify repurchase-ready customers. Autotrader and Kelley Blue Book surface personalized vehicle recommendations. |
| Inventory Acquisition | Only 14% offered a trade-in valuation in service; 33% want one; $3,195 is the repair-vs-trade tipping point | vAuto gives service advisors real-time trade-in valuations at the moment of the repair estimate. Dealertrack DMS and Xtime share a single customer record so the conversation happens in the moment — without switching systems. |
When these tools share data — when the CRM knows what happened in the service lane, when the service advisor knows a customer is approaching their repurchase window — the dealership stops reacting and starts leading.
Your Move
Ask your Cox Automotive rep one question: ‘Are my service data and my CRM data talking to each other?’ If the answer is no, that’s where the value is leaking. Not just in service. Everywhere.
“High‑performing dealerships recognize that service plays a central role across the business—not just as a department, but as a key point of connection with the customer.”

Skyler Chadwick,
Director of Product Consulting, Cox Automotive
You can’t win auto retail without the full picture. The service lane is where that picture starts.
Related Research
-
2025 Car Buyer Journey Study: Topline Findings for Dealers
Dealer-focused highlights from Cox Automotive’s 16th Annual Car Buyer Journey Study (2025), based on an online survey of 2,344 recent vehicle buyers. Learn how new and used buyers shop today—satisfaction trends, online steps completed, cross‑shopping…
-
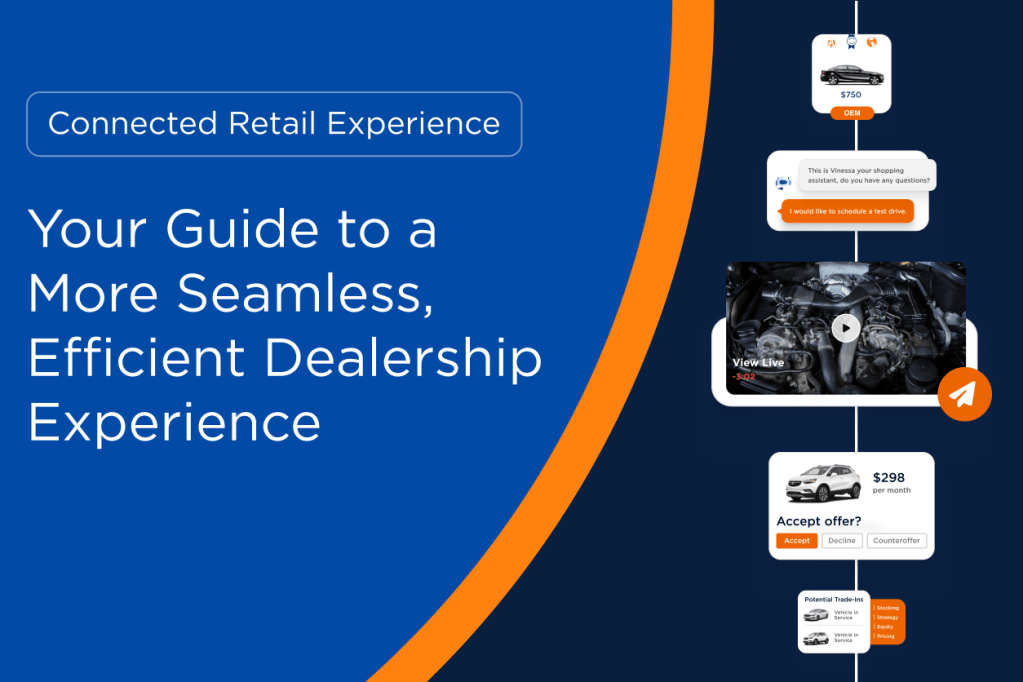
Connected Retail Dealership Experience
Connected Retail Experience Your Guide to a More Seamless,Efficient Dealership Experience Why Connected Retail Experiences Matter Modern shoppers expect speed, personalization, and continuity across every touchpoint. Connected systems make that possi…
-
What Dealers Need to Know About AI Right Now: Discovery, Data, and Decisions
Summary: Artificial intelligence is not a theoretical discussion. The question is no longer whether AI will matter, but how will it influence discovery, data strategy, and daily decisions across the dealership.…

-
Your Guide to What’s Next in Automotive Retail
Industry Game Changers Your Guide to What’s Next in Automotive Retail From compliance to customer experience, discover the tools and strategies you need to drive growth, efficiency, and profitability this year and beyond. AI is transforming the way d…

FAQs
Dealership service and parts revenue has grown 33% since 2018, reaching an average of $9.23 million per store. But dealer share of total service visits has fallen from 33% to 29% over the same period, even as the total number of vehicles in operation grew 7% to nearly 299 million.
The sharpest losses are among newer vehicles. Dealership share of service visits for vehicles less than two years old dropped from 68% to 55% since 2018. For vehicles two to five years old, it fell from 58% to 45%. Meanwhile, the number of auto mechanic businesses in the U.S. has grown 12% to roughly 299,000, with general repair shops, quick lube outlets, and mobile service providers all gaining share.
General repair now surpasses dealerships as the most preferred service provider (33% vs. 31%), driven primarily by perceptions of lower cost and more convenient locations. In practice, revenue growth is masking a structural shift: dealers are monetizing fewer customer relationships more heavily rather than retaining a broad base of loyal service customers. The takeaway is that top-line service growth alone is not a retention strategy. Dealers must focus on visit share, not just repair order dollars.
Source: 2025 Cox Automotive Fixed Ops and Ownership Study
Dealerships lose service customers through friction and failed handoffs, not price. According to the 2025 Cox Automotive Service Industry Study, 45% of dealership service customers report at least one frustration with their visit. The top issues are service taking longer than expected (24%), difficulty finding out how much the dealership charges (13%), feeling pushed toward additional services (13%), and the final price exceeding the estimate (12%).
The defection often starts before the first service visit happens. Eighty percent of new car buyers say they would likely service at the selling dealership, but only 23% have a first service appointment scheduled for them and only 25% are introduced to the service department. That gap allows competitors to intercept customers early. Once a customer services elsewhere, only 20% consider switching to a dealership.
The trend is visible over time. The percentage of consumers returning to the dealership where they purchased their vehicle for service has declined across all vehicle age groups since 2018 — from 72% to 54% among owners of vehicles less than two years old, and from 70% to 51% for vehicles two to five years old. When asked why they don’t return, the number-one reason is convenience (not a convenient location), followed by four value-related concerns: perceptions of overcharging, unreasonable total cost, unreasonable labor charges, and unreasonable parts charges.
Notably, the perception that dealerships cost more is often inaccurate. Average customer spend at a dealership ($261) is actually lower than at a general repair shop ($275). But dealers are not consistently communicating this — only 55% of consumers say the ability to compare prices is an important feature they look for on a dealership website or app.
The takeaway: Dealers lose customers quietly and early, through small operational misses that compound into permanent defection — long before repair quality becomes a factor.
Source: 2025 Cox Automotive Fixed Ops and Ownership Study
The first service visit is the tipping point for long-term dealership loyalty. Before any service visit, dealerships and general repair/service stations start with equal consumer consideration — 41% for dealers and 42% for general repair, according to the 2025 Cox Automotive Ownership Study. After a dealership service visit, 89% of customers consider returning.
By contrast, among consumers who service somewhere other than a dealership, only 20% consider switching to a dealership. This makes the initial service experience disproportionately valuable — it is the moment where the competitive playing field shifts dramatically in the dealer’s favor.
Yet most dealers are not activating this advantage. According to the 2025 Cox Automotive Car Buyer Journey Study, only 25% of all buyers are introduced to the service department during the purchase process. Only 23% have a first service appointment scheduled for them. Among new car buyers specifically, those numbers are higher (32% introduced, 30% scheduled) but still represent a significant execution gap given that 80% of new buyers say they would likely service at the selling dealership.
The takeaway: winning the first service visit dramatically increases long-term retention. The sales-to-service handoff — introducing buyers to the service team and scheduling that first appointment before they leave the lot — should be treated as a core part of the purchase process, not an afterthought.
Source: 2025 Cox Automotive Fixed Ops and Ownership Study
Trust is the number-one reason consumers return to a dealership for service, according to the 2025 Cox Automotive Ownership Study. When asked which single factor most influences their decision to return to the dealership where they purchased their vehicle, 22% of consumers chose “I trust them” — ahead of the deal they received on their vehicle (12%), knowledge of their service history (11%), dealership location (8%), and general friendliness (8%).
That trust is built on several factors consumers describe in their own words: expertise from factory-trained technicians, access to the vehicle’s full-service history, warranty coverage, and transparent communication about what work is needed and why.
Trust also drives revenue beyond the service lane. Trust in the dealership is the number-one motivator for consumers considering a new vehicle purchase or lease (60%), and this effect is significantly stronger among consumers who already service at a dealership. Among buyers who returned for service in the past 12 months, 74% say they are likely to repurchase from the same dealer, compared to just 44% of those who did not return for service.
The takeaway: Service loyalty is built on demonstrated competence and transparency, not discounts. Trust built in the service lane compounds across the full ownership lifecycle — driving repeat service visits, future vehicle purchases, and referrals.
Source: 2025 Cox Automotive Fixed Ops and Ownership Study
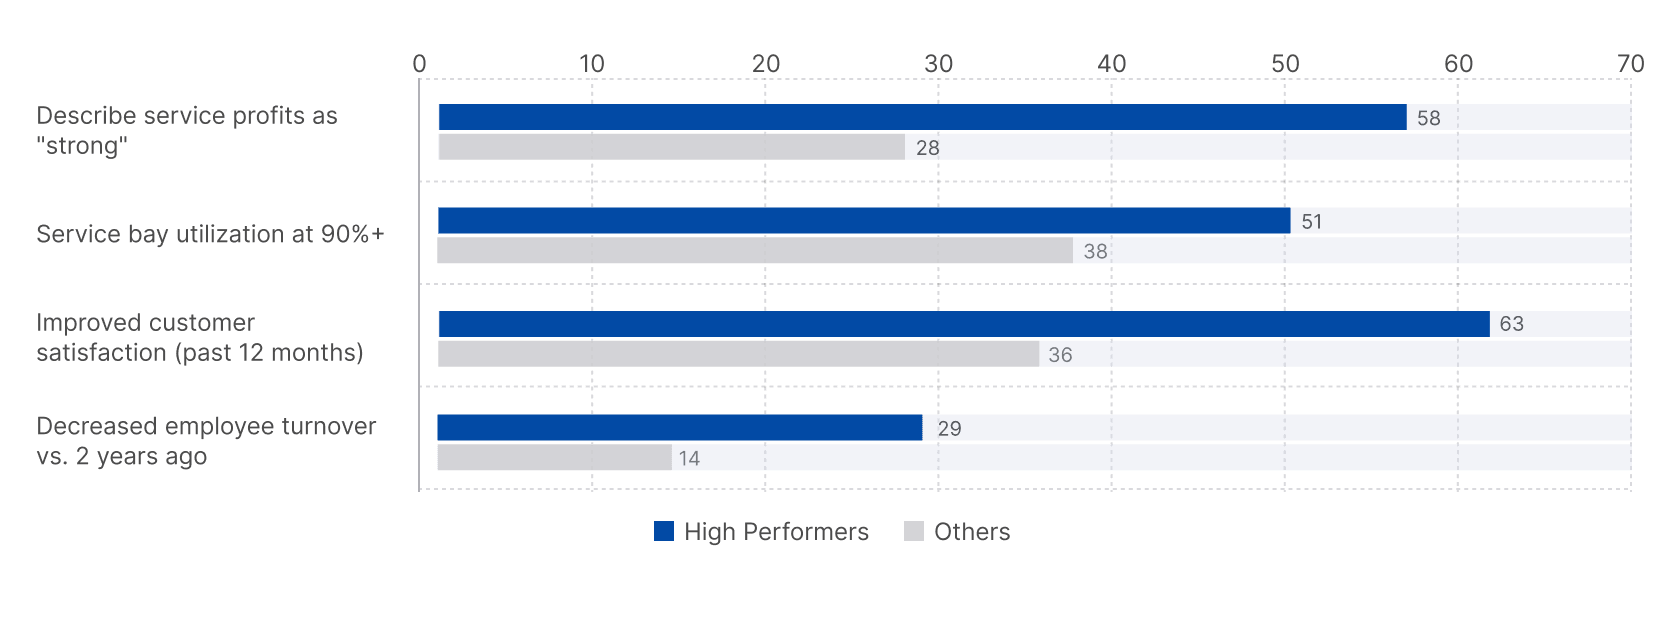
The 2025 Cox Automotive Ownership Study identified a group of dealers it calls “Thrivers” — the 50% of fixed operations decision makers who reported both more efficient and more profitable service departments over the past year. Their practices diverge measurably from other dealers.
On profitability, 58% of Thrivers describe service profits as strong, compared to 28% of non-Thrivers. They report higher revenue per repair order across service types: 31% report $400 or more per customer pay RO (vs. 19%), and 35% report $500 or more per dealership service RO (vs. 23%). Their average absorption rate is also higher (73 vs. 70).
Operationally, Thrivers maximize shop capacity. They are significantly more likely to sell 100 or more shop hours per day (51% vs. 38%) and to operate at 90% or higher bay utilization (23% vs. 16%).
On technology, Thrivers use an average of 11 digital tools compared to 9 for non-Thrivers. They lead in adoption of photo and video tools for repair recommendations (47% vs. 34%), electronic estimate approval (62% vs. 50%), third-party financing options (42% vs. 31%), and marketing and declined service recapture tools (54% vs. 39%).
The results extend beyond fixed ops: 45% of Thrivers report improvement in vehicle sales volume (vs. 24%), and they rate service-to-sales department integration significantly higher (58% rate it 8+ on a 10-point scale vs. 44%).
The takeaway: High-performing service departments treat fixed ops as a strategic business connected to sales, inventory, and customer lifetime value — not an isolated profit center.
Source: 2025 Cox Automotive Fixed Ops and Ownership Study
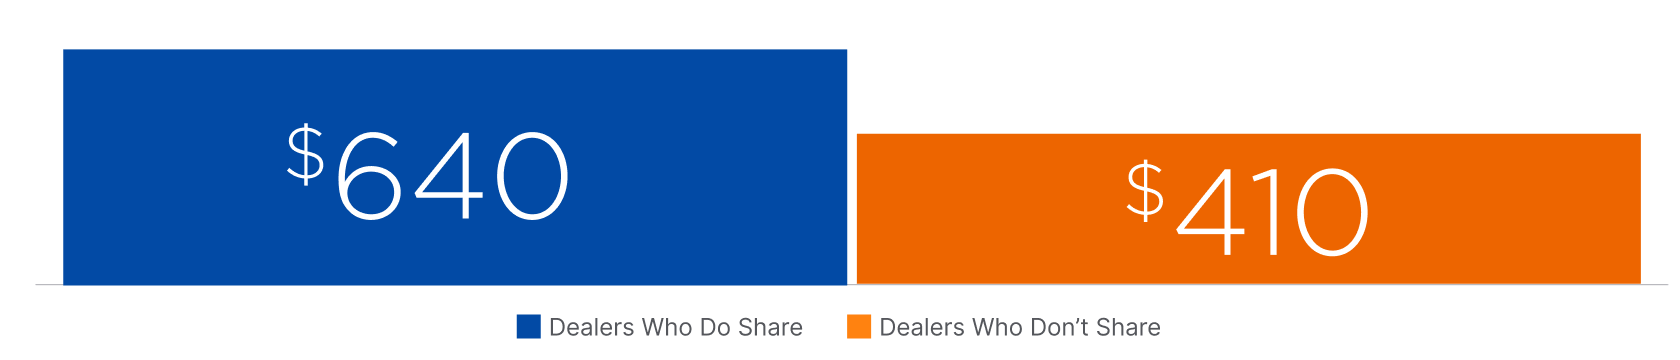
Photos and videos of recommended repairs are one of the highest-ROI tools available to dealership service departments. According to the 2025 Cox Automotive Ownership Study, consumers who received dealership-provided photos or videos spent an average of $640 per repair order out of pocket, compared to $410 among those who did not — a difference of approximately $230 per RO.
The mechanism is straightforward: visual evidence builds trust and accelerates approval. Among dealership servicers who received photos or videos, 65% say it builds trust with their service provider, 63% say they are more likely to approve recommended services, and 62% say they approve services faster.
On the dealer side, high-performing dealers are significantly more likely to offer this capability. Sixty-four percent of Thrivers send customers videos or pictures of recommended repairs via text or email, compared to 48% of non-Thrivers — a 16-point adoption gap.
Consumers who have used or found photo and video tools helpful also report broader behavioral impact: 49% say they are more likely to approve recommended services, 45% say they are more likely to recommend the service department to others, and 34% say they visit that service department more often.
The takeaway: Photo and video tools deliver one of the clearest, most measurable returns on service-lane technology investment — higher per-RO spend, faster approvals, and stronger customer trust.
Source: 2025 Cox Automotive Fixed Ops and Ownership Study
The connection between the service experience and future vehicle purchases is one of the strongest findings in Cox Automotive’s research. Among buyers who returned to a dealership for service in the past 12 months, 74% say they are likely to repurchase from that same dealership. Among those who did not return for service, that number drops to 44% — a 30-point gap.
Put another way, buyers who come back for service are nearly twice as likely to buy their next vehicle from the same dealer.
The effect is reinforced by broader consumer sentiment: 88% of consumers say the service experience directly impacts their likelihood to return to that dealer for a future purchase. And among consumers who rate their likelihood to return for service as high, 86% report high satisfaction with the dealer experience and 74% say they trust the dealer gave them the best deal — compared to 59% and 40%, respectively, among those less likely to return.
High-performing dealers recognize this connection. They rate their service-to-sales department integration significantly higher (58% rate it 8+ vs. 44% of non-Thrivers), and 79% of Thrivers say technology has improved collaboration between their service and sales departments, compared to 62% of non-Thrivers.
The takeaway: Every service visit either strengthens or weakens the dealership’s future sales pipeline. Dealers who treat service as a standalone department are missing its most valuable function — keeping customers in the buying ecosystem.
Source: 2025 Cox Automotive Fixed Ops and Ownership Study
The service lane is one of the most underleveraged inventory sourcing channels available to dealers. According to the 2025 Cox Automotive Service Industry Study, only 14% of consumers have been offered a trade-in value during a service visit, yet 33% say they are highly interested in receiving one — a 19-point execution gap.
Consumer behavior supports the opportunity. The preference for replacing a vehicle rather than paying for costly repairs has shifted significantly: in 2022, 70% of consumers facing high repair costs preferred to repair. By 2024, that dropped to 53%, with 47% now preferring to replace. Consumers begin considering a trade-in over repair at approximately $3,195 in repair costs, making the service lane a natural decision point.
According to the 2025 Cox Automotive Ownership Study, high-performing dealers have already operationalized this channel. Among Thrivers, 86% have an established process for acquiring inventory through the service lane, compared to 72% of other dealers. The benefits they cite include lower reconditioning risk due to known vehicle history (58%), building trust with service customers (54%), reduced reliance on auction and wholesale channels (48%), and faster time-to-lot compared to outside channels (40%).[DC1]
Consumer receptivity is also high: 69% of all consumers find it valuable to always know their vehicle’s current market value, rising to 76% among those who service at a dealership. And 84% say third-party valuation backing increases their confidence in the offer[DC2] .
The takeaway: Service visits present one of the most qualified, lowest-risk inventory acquisition opportunities available — but most dealers are not yet making the ask.
Source: 2025 Cox Automotive Fixed Ops and Ownership Study
Personalized communications are widely valued by service customers — and significantly more so among those who service at a dealership. According to the 2025 Cox Automotive Ownership Study, the most helpful communication touchpoints for dealership servicers are special discounts or coupons (84%), personalized service reminders based on vehicle mileage or age (80%), and text message updates about upcoming or scheduled service (79%).
Reminders about previously declined maintenance are also well received (69% of dealership servicers find them helpful), as are email newsletters with tips and offers (62%) and personalized alerts about trade-in timing (59%).
These preferences translate into real behavior. Personalized service reminders drive unplanned service visits for 47% of dealership servicers, compared to 39% of those who service elsewhere — a significant difference. Reminders about previously declined services are also more influential among dealership servicers (28% vs. 23%).
For dealers, the scheduling preference data reinforces the digital expectation: online scheduling is significantly more preferred among those who service at a dealership (55%) compared to those who service elsewhere (43%). Sixty percent of dealership servicers rate detailed service reminders and the ability to schedule appointments online or via mobile app as very or somewhat important in choosing a service provider — compared to 46% of non-dealership servicers on both measures.
The takeaway: Dealership service customers expect and respond to personalized, proactive outreach. Reminders, declined-service follow-ups, and digital scheduling aren’t just convenience features — they are retention tools that directly drive additional visits and revenue.
Source: 2025 Cox Automotive Fixed Ops and Ownership Study
A growing number of consumers are using AI tools in their vehicle service decisions, though trust remains a barrier. According to the 2025 Cox Automotive Ownership Study, 16% of consumers used an AI website or tool to research their last service provider. Looking ahead, 83% of consumers say the rise of technologies like AI will impact the way they purchase vehicles over the next 10 years.
Among consumers who have used AI for service-related tasks, the top use cases are comparing prices between service providers (48%), determining what services their vehicle might need (48%), identifying or selecting a service provider (46%), and diagnosing their vehicle’s issue (45%).
However, only 46% of all consumers say they are very or somewhat likely to trust AI’s recommendations for vehicle servicing. The consumers who do trust AI tend to be younger, more affluent, and more likely to be parents (60% vs. 39%). They are significantly more likely to own newer vehicles, hold warranties or service contracts, and report higher overall service satisfaction (93% vs. 84%). They also spend more per repair order on average ($439 vs. $381).
On the dealer side, high-performing dealers are moving faster on AI adoption. Twenty percent of Thrivers have adopted AI-generated invitations to discuss vehicle value or trade-in timing, compared to 11% of non-Thrivers. And 63% of dealers say investing in AI now is critical for long-term business success.
The takeaway: Consumer AI adoption in service is early but accelerating. Dealers who integrate AI-powered tools for pricing transparency, service recommendations, and proactive outreach are positioning themselves for where consumer expectations are heading.
Source: 2025 Cox Automotive Fixed Ops and Ownership Study
About This Research
This page draws from the 2025 Cox Automotive Fixed Ops and Ownership Study, a 20-minute online survey of 500 fixed operations decision makers at franchise dealers and 2,502 consumers who had a service visit in the past 12 months, fielded September–October 2025. Supplementary findings are drawn from the 2025 Cox Automotive Service Industry Study (1,974 vehicle owners, fielded April–May 2025) and the 2025 Cox Automotive Car Buyer Journey Study (2,344 vehicle buyers, fielded August–September 2025).
Media contact: Lisa Aloisio Lisa.Aloisio@coxautoinc.com 404.725.0651