August brought further evidence of a steadily maturing electric vehicle (EV) market. New and used EV sales increased from July, inventory levels moved closer to ICE+ vehicles and growing off-lease returns continued to expand used EV availability. At the same time, lower-priced models gained share in the new market, helping narrow the price gap between EVs and ICE+ vehicles.
New and Used EV Sales – August
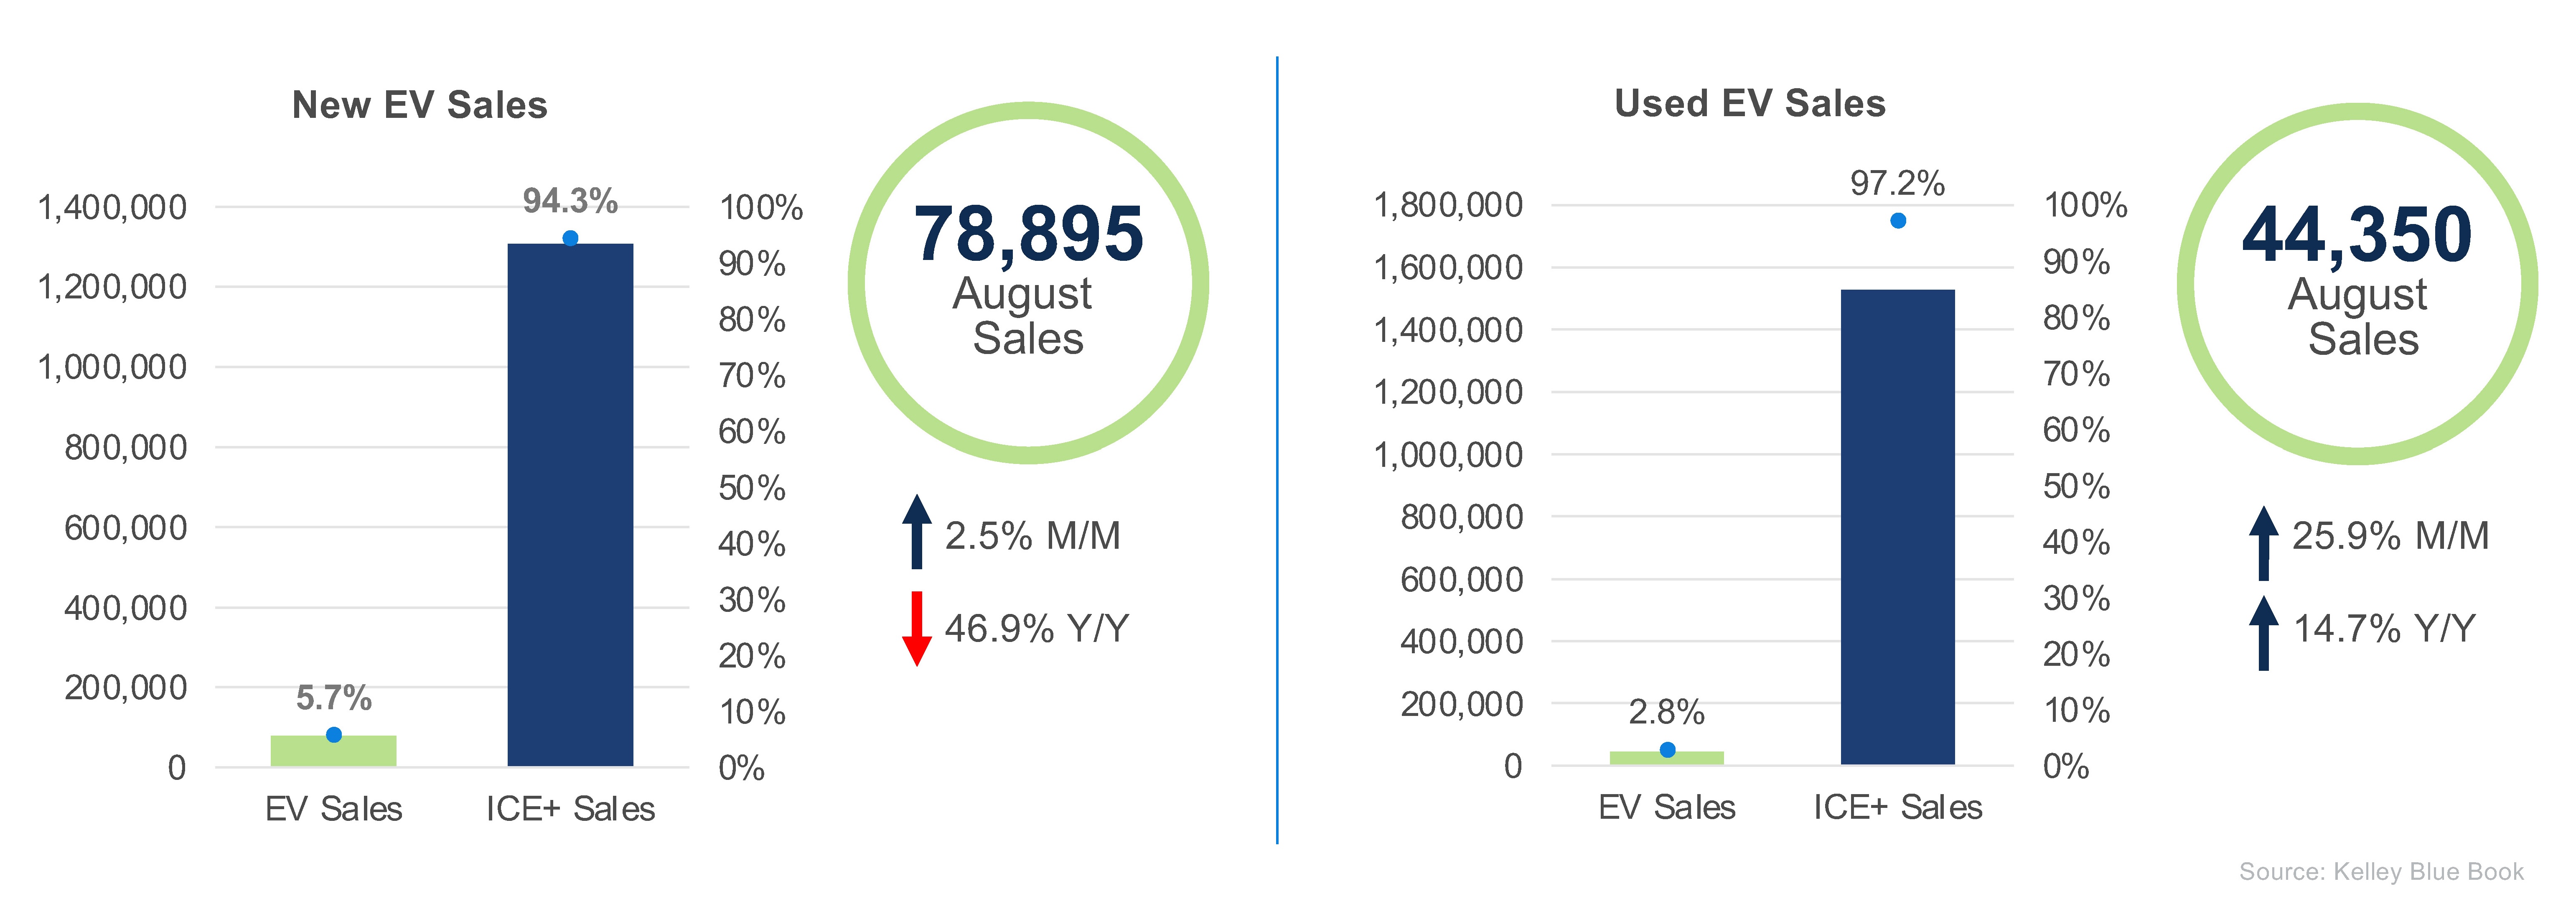
New EV Sales: New EV sales totaled an estimated 78,895 units in August, up 2.5% from July but down 46.9% from a year earlier. The sizeable decline was expected, as August 2025 set a record for new EV volume in the U.S. Growth across several automakers more than offset Tesla’s decline in August, highlighting a market that is becoming less dependent on a single brand for sales growth. EVs accounted for 5.7% of total new-vehicle sales, essentially unchanged from July.
Tesla remained the dominant player with 40,816 units sold, followed by Toyota, Rivian, Hyundai and Cadillac. Tesla sales declined 3.8% from July, reducing its share of EV sales to 51.7%, down 3.4 percentage points from the prior month. Meanwhile, Toyota continued to gain momentum, with sales climbing 34.9% month over month to 4,964 units, led by the Toyota bZ, whose sales increased 39.6% from July and boosted its share of EV sales by a full percentage point. Chevrolet (+30.3%), Cadillac (+13.1%) and Kia (+12%) also posted solid gains.
Used EV Sales: Used EV sales increased 25.9% month over month and 14.7% year over year in August to 44,350 units. Growing off-lease returns continue to expand used EV availability, providing a larger pool of vehicles for consumers and supporting strong sales growth. EV market share edged up slightly to 2.8%. Tesla, Ford, Hyundai, BMW and Chevrolet were the top five brands by used EV sales.
Tesla continued to be the primary driver of market growth, with sales of used Tesla products increasing 26.5% from July; nearly 30% of used EVs sold in August were Tesla models. Several legacy brands also recorded outsized gains, led by Nissan (+45.1%), Cadillac (+37.7%), and Kia (+32.1%). At the model level, the Tesla Model 3, Tesla Model Y and Ford Mustang Mach-E generated the largest month-over-month volume increases.
New and Used EV Days’ Supply – August
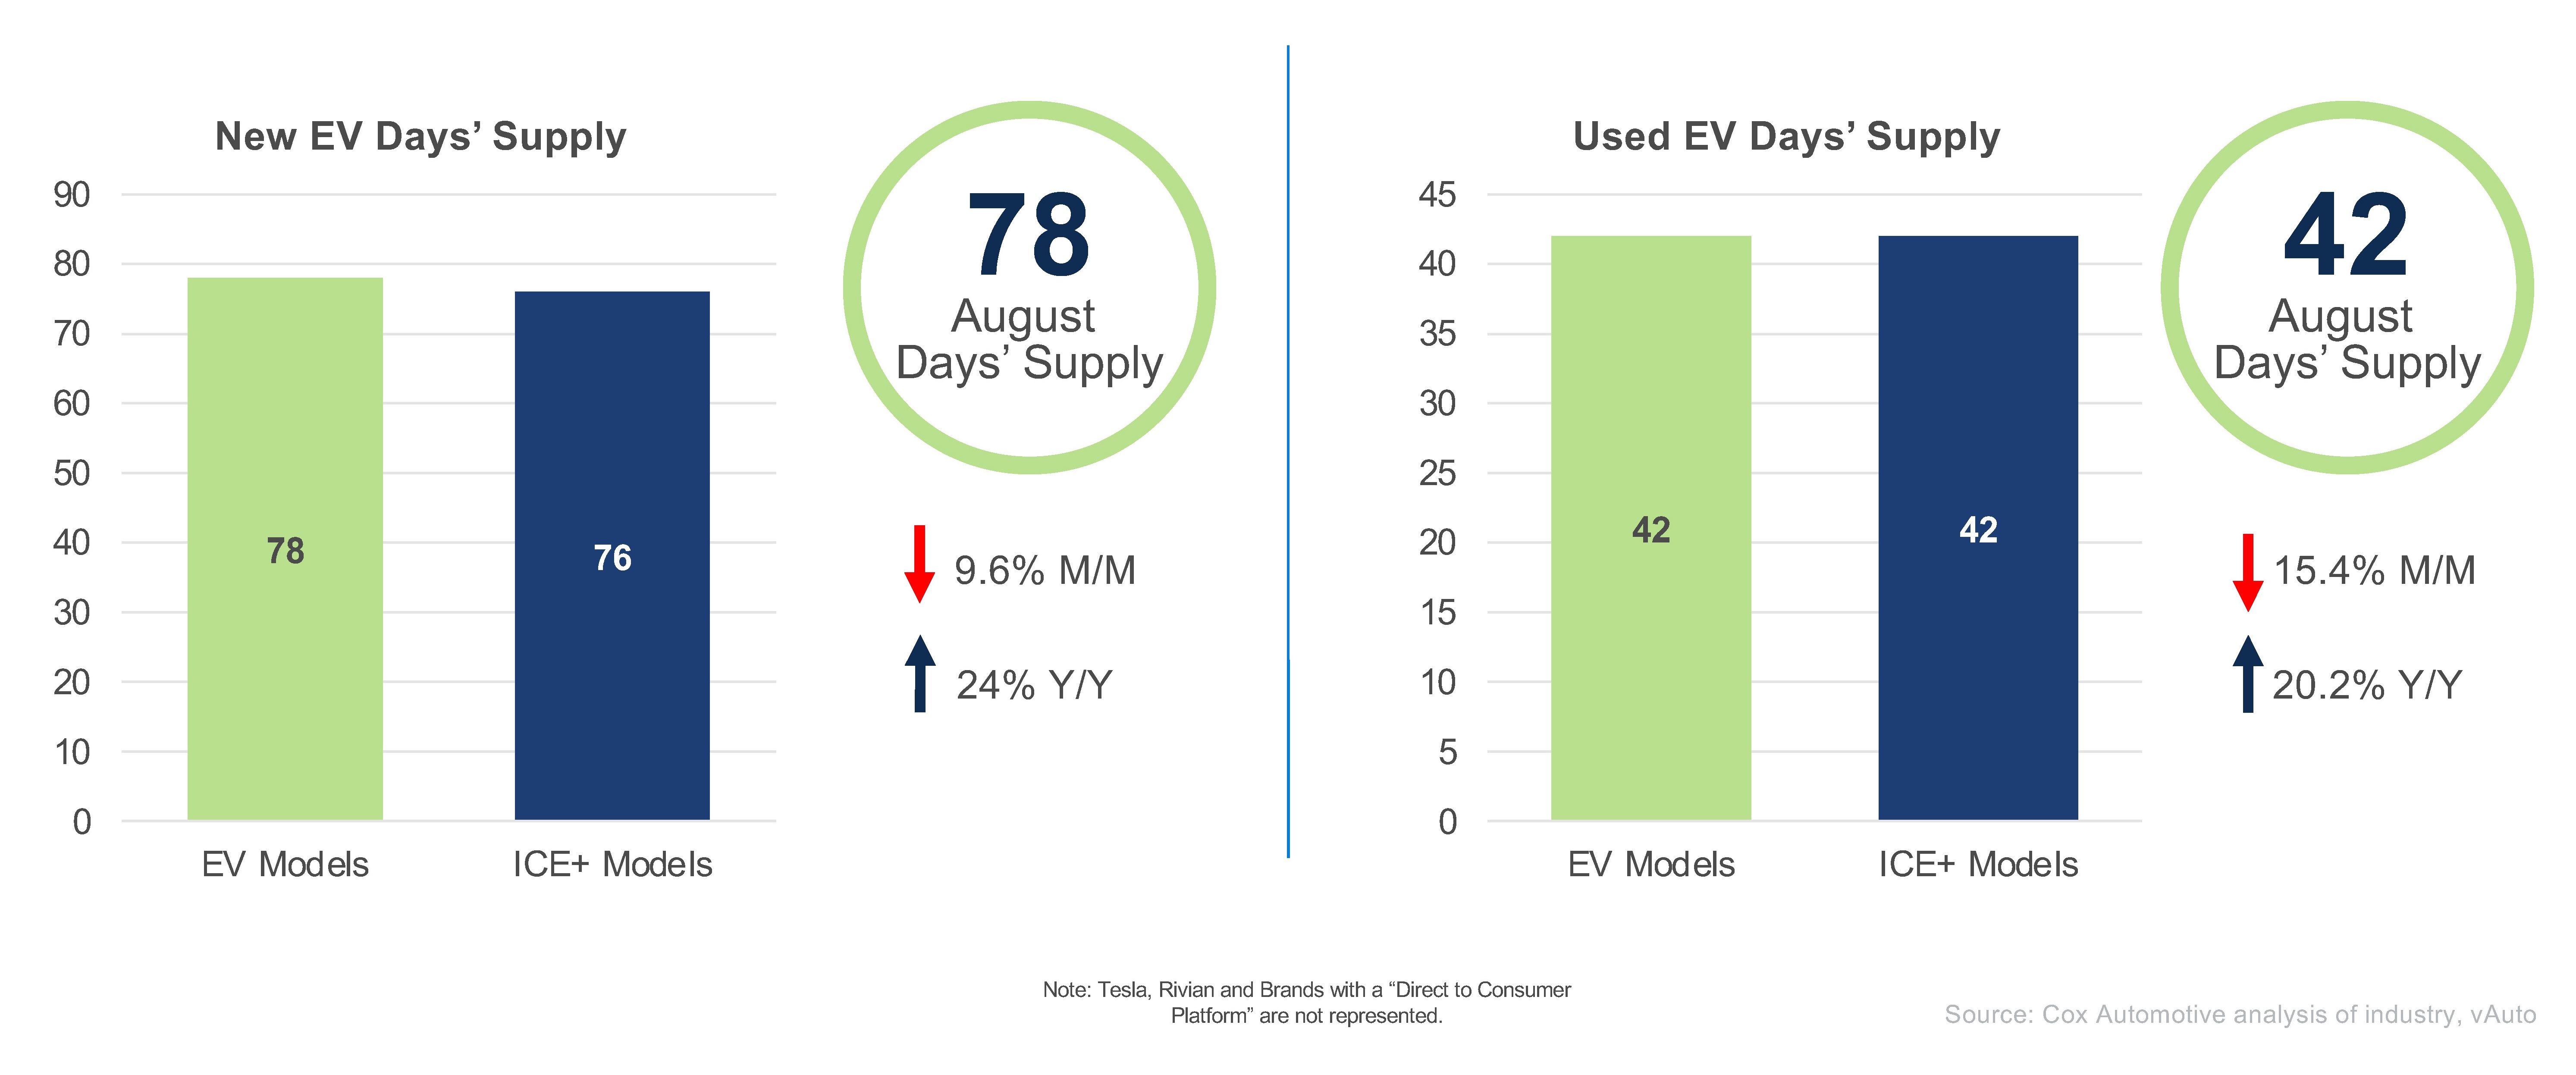
New EV Days’ Supply: Days’ supply decreased to 78 days in August, down 9.6% month over month but higher by 24% year over year. EV inventory now sits just two days above ICE+ levels, marking the narrowest inventory gap of the year.
While the overall market continues to rebalance, inventory levels remain highly uneven across brands. Subaru remained the leanest brand by a wide margin, with supply falling to 26 days in August from 47 in July. Porsche and Toyota also recorded large inventory reductions, with supply declining by 35 and 33 days, respectively, though both remain above the industry average. Meanwhile, Cadillac, Mercedes-Benz and Audi were among the few brands to see supply rise.
Used EV Days’ Supply: Used EV supply and demand moved into balance in August, with days’ supply reaching parity with ICE+ levels for the first time this year. Days’ supply fell to 42 days in August, down 15.4% month over month, though still up 20.2% year over year. Availability tightened broadly across brands, suggesting demand remains healthy, with used Hyundai EVs among the leanest, at 36 days. Availability of used Cadillacs and BMWs tightened in August, while availability of Mercedes-Benz EVs recorded the highest days’ supply among major brands at 57 days.
Note: Tesla and Rivian figures reflect only vehicles available through traditional dealerships and exclude vehicles at factory-owned outlets.
New and Used EV Prices – August
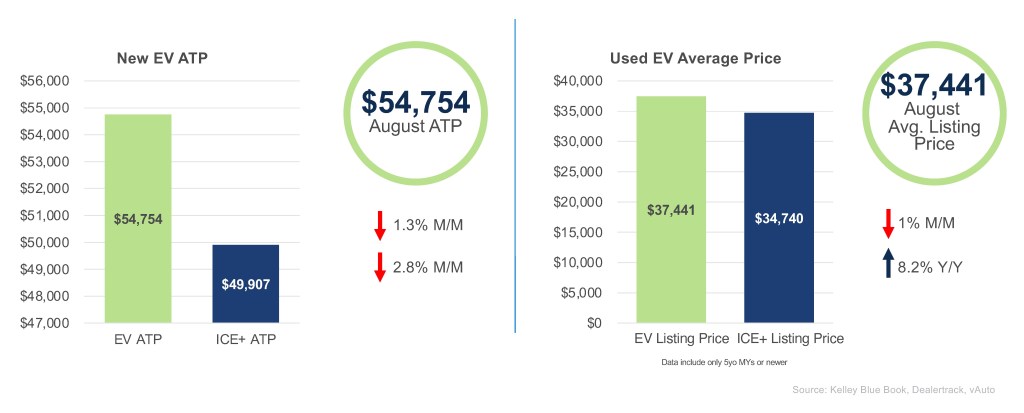
New EV ATP: The EV price gap continued to narrow in August as lower-priced models gained share and EV demand increasingly shifted toward products priced closer to comparable ICE+ alternatives. The average transaction price (ATP) for a new EV declined to $54,754 in August, down 1.3% month over month and 2.8% year over year. Incentives averaged 12% of ATP, or approximately $6,594 per vehicle, down 2.2% from July and 19.9% from a year ago. The EV price premium over ICE+ vehicles narrowed to $4,847, or 9.7%, continuing the trend toward price parity between EVs and ICE+ vehicles.
The decline in ATP was driven by a combination of stronger sales for lower-priced models such as the Toyota bZ, Chevrolet Bolt and Toyota C-HR, along with softer transaction prices for several popular EV nameplates, particularly the Tesla Model 3, whose ATP declined 1.9% from July.
For more details, read the August Kelley Blue Book ATP report.
Used EV Listing Price: Used EV prices eased modestly in August, but values remained well above year-ago levels, indicating that growing supply continues to be met with healthy consumer demand. The average listing price for a used EV was $37,441 in August, down 1% month over month but 8.2% higher year over year. The used EV premium over ICE+ vehicles narrowed to 7.8%, as lower-priced brands and models captured a larger share of market activity.
Tesla remained largely price-neutral in August, with average prices increasing 0.7% month over month while maintaining nearly 30% market share. Instead, the decline in overall used EV pricing was driven primarily by lower-priced brands gaining share and falling prices among several high-volume non-Tesla models — Cadillac LYRIQ sales increased 46% month over month while average prices declined 2.6%, and Chevrolet Blazer EV sales rose 44% as prices fell 5.7%.
Looking Ahead
As the impact of last year’s tax-credit-driven surge continues to fade, attention is shifting to whether recent EV market improvements can be sustained. EV inventory levels are now closely aligned with ICE+ vehicles for the first time in months. Meanwhile, expanding off-lease supply continues to reshape the used market. Pricing, incentives and the market’s ability to absorb growing used EV volumes will be key indicators to watch in the months ahead.
The EV Market Monitor gauges the health of the new and used electric vehicle (EV) markets by monitoring sales volume, days’ supply and average pricing. Each metric will be measured month over month and year over year.
Follow the link to view the entire series of EV Market Monitor reports.
For the official quarterly report on EV sales data, see the Q2 Electric Vehicle Sales Report.