Key Metrics
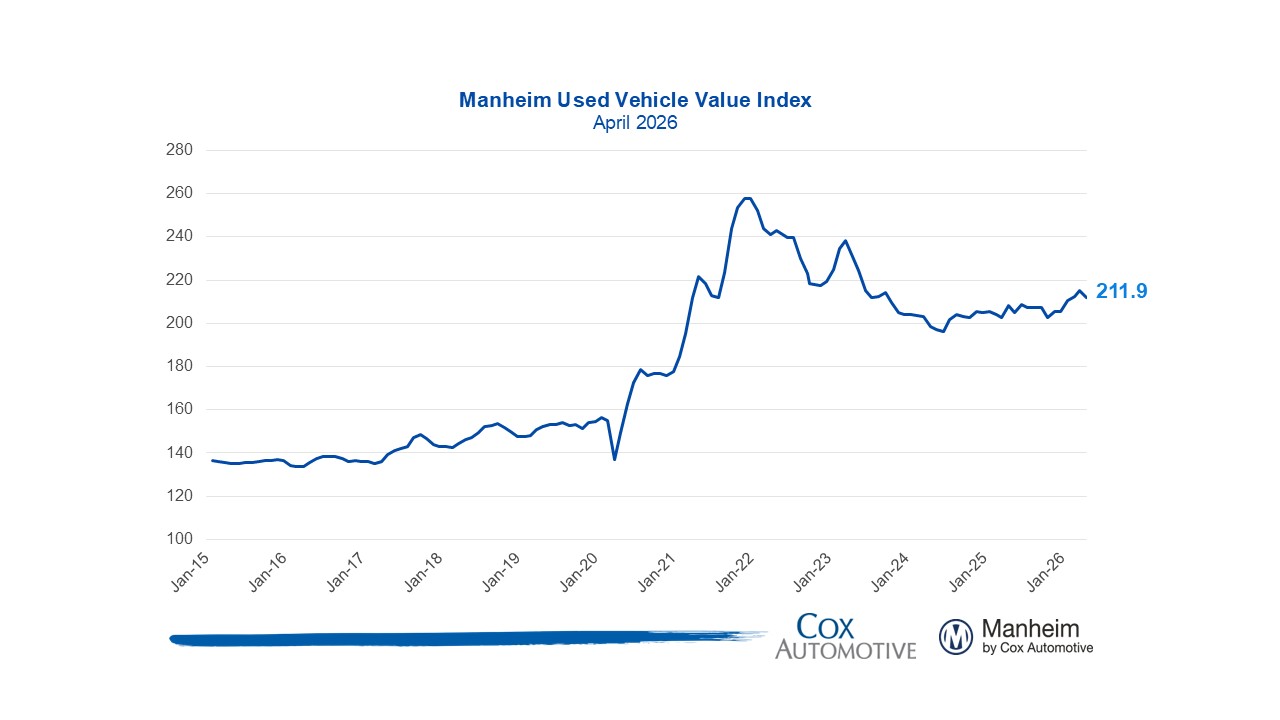
- The Manheim Used Vehicle Value Index (MUVVI) fell to 211.9, reflecting a 1.8% increase for wholesale used-vehicle prices (adjusted for mix, mileage, and seasonality) compared to April 2025. The April index is down 1.6% month over month. The long-term average monthly move for April is an increase of 0.7%.
- Non-adjusted wholesale vehicle prices are now up 2.8% year over year, and up 0.4% against March 2026. The long-term average monthly move in non-adjusted values is an increase of 1.3% in April.
Expert Perspective — Jeremy Robb, Chief Economist, Cox Automotive
“A strong tax refund season drove consumers toward used vehicles early this year, and that kept demand and values high at Manheim through the spring market. The conflict in the Middle East has now been ongoing for two months, and while energy prices backed off a bit in mid-April, they have reaccelerated to the upside: the price of gas just hit a high for the year and is up 47% since the end of February. Those higher prices are soaking up a lot of the extra money in consumers’ pockets, and currently there’s no end in sight.
The Manheim Index fell in April and non-seasonally adjusted values weren’t quite as strong as normal for this time of year. But that doesn’t mean prices are weak — current values are declining at normal rates for this time of year and remain elevated against long-term averages for the end of April. Buying interest in electric vehicles (EVs) is also on the rise, pushing wholesale EV prices to outperform non-EVs for both the index and non-seasonally adjusted values as well.
Affordability remains front and center, and that’s driving some increased demand for older vehicles at Manheim as well as changing the calculus for consumers shopping for EVs. As we get into the summer months, we will continue to see off-lease EV maturities multiply at Manheim, and that may put downward pressure on valuations. But right now, they are strong, and shoppers are considering these vehicles as a viable alternative.”
Prices, Retention & Sales Conversion
- MMR prices for the Three-Year-Old Index decreased 0.4% in April.
- MMR retention averaged 99.7%, down 0.5 percentage points year over year and down 0.7 percentage points from March.
- Sales conversion was 63.7% for the period, 3.3 percentage points higher than the most recent three-year average for April but down 3.5 percentage points from the March rate.
Takeaway: MMR prices for the Three-Year-Old Index decreased more than is typical for this period. MMR retention fell slightly and is seasonally normal for this time of year. Meanwhile, sales conversion indicates a slight softening of demand but remains above usual levels for this time of year.
Segment Performance: Year-Over-Year Price Changes
Overall market prices were up notably from a year ago, led by continued strength in the luxury segment, while SUVs lagged considerably.
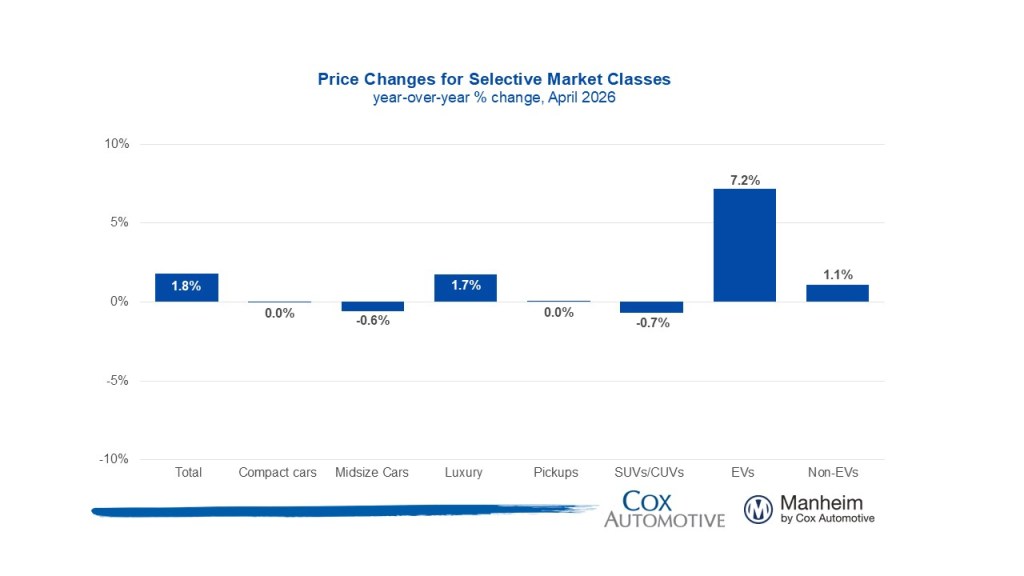
Takeaway: The luxury segment continues to show strong performance, as do EVs, while prices for midsize cars and SUVs lag compared to this time last year.
EV versus Non-EV Index
- EVs: The Electric Vehicle (EV) Index was up 7.2% year over year and up 1.4% from March.
- Non-EVs: The Non-EV Index was up 1.1% year over year and lower by 2.2% from March.
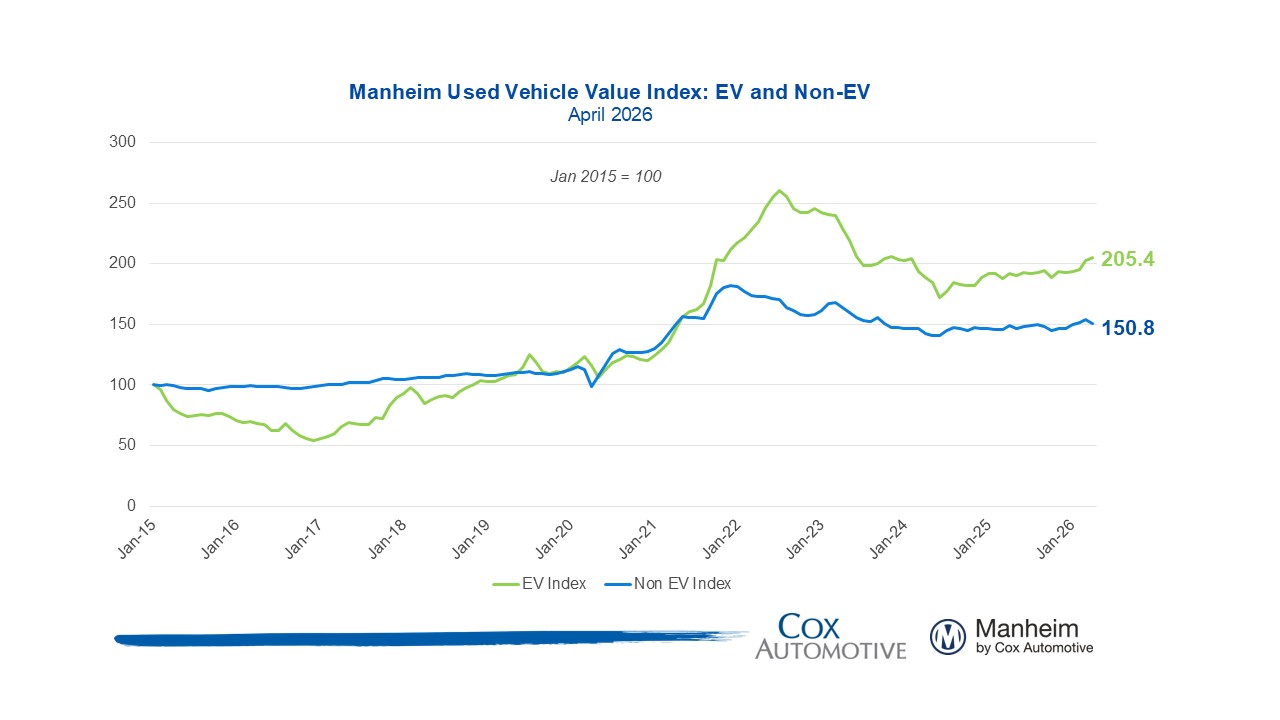
Takeaway: Both EV and Non-EV continue to see elevated prices against this time last year, with EVs showing strength in the last month while Non-EVs softened.
Wholesale Supply & Rental Prices
- Wholesale supply: At the end of April, wholesale days’ supply rose to 25.2 days, higher by 0.9 days year over year and higher by 0.3 days compared to March.
- Rental prices: Prices for rental vehicles are up 2.0% year over year but declined in April, falling 3.3% from March. On a non-seasonally adjusted basis, rental values remain 3.2% higher than this time last year, though they dropped 1.4% in April. Average mileage is lower, down 17.4% compared to last April.
Takeaway: Days’ supply in April was slightly higher than recent historical norms. Rental values fell against March, despite a decline in average mileage M/M.
View historical MUVVI reports here.
For more information on Manheim, visit Manheim.com.
The Manheim Used Vehicle Value Index (MUVVI) is a trusted benchmark for tracking wholesale used-vehicle prices in the U.S., which helps dealers and analysts gauge market shifts and anticipate retail trends. The official measure is reported on the fifth business day of each month. The mid-month MUVVI number is a checkpoint number, is not an official reading and should not be compared to the official index reading. The mid-month is not a flash estimate, and it is not meant to provide any directional estimate of the full-month number. The next complete suite of monthly MUVVI data will be released on Tuesday, April 7, 2026. Register to attend the Q1 MUVVI call on Tuesday, April 7, 11 a.m. EDT.
For questions or to request data, please email manheim.data@coxautoinc.com. If you want updates about the Manheim Used Vehicle Value Index, as well as direct invitations to the quarterly call sent to you, please sign up for our Cox Automotive newsletter and select Manheim Used Vehicle Value Index quarterly calls.
Note: The Manheim Used Vehicle Value Index was adjusted to improve accuracy and consistency across the data set as of the January 2023 data release. The starting point for the MUVVI was adjusted from January 1995 to January 1997. The index was then recalculated with January 1997 = 100, whereas prior reports had 1995 as the baseline of 100. All monthly and yearly percent changes since January 2015 are identical. Learn more about the decision to rebase the index.