Key Metrics
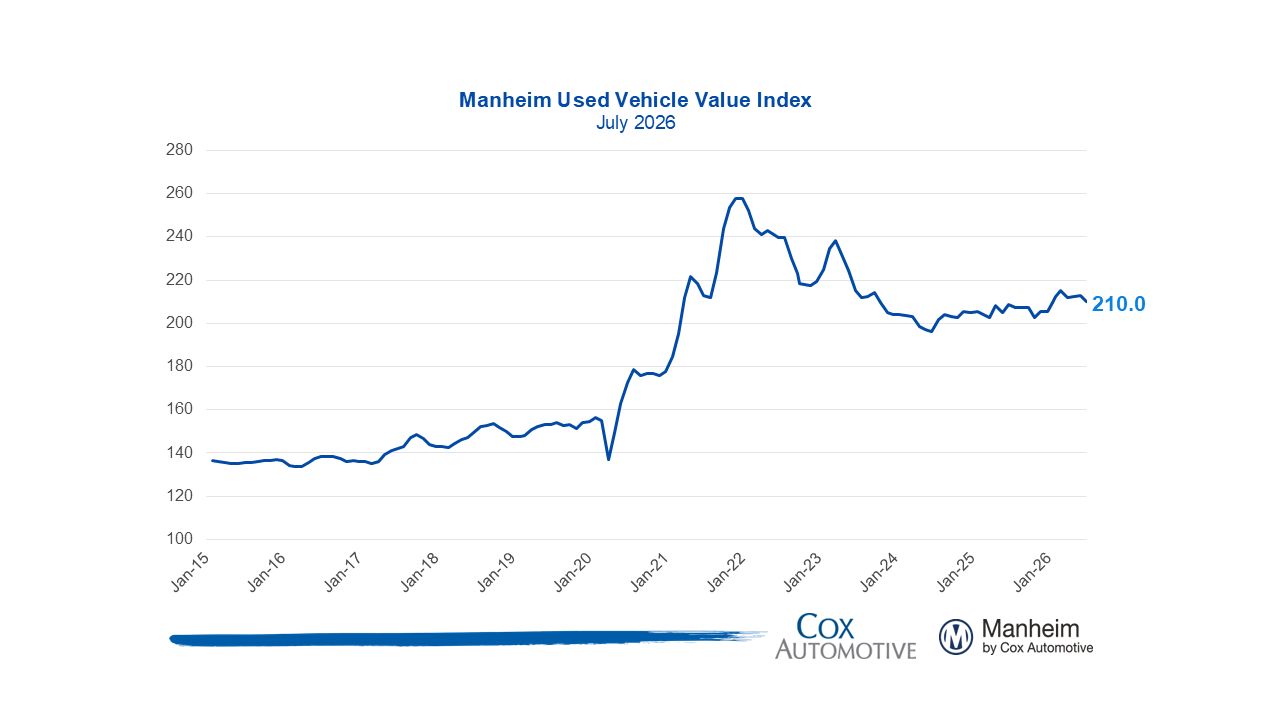
- The Manheim Used Vehicle Value Index (MUVVI) fell to 210, reflecting a 1.3% increase for wholesale used-vehicle prices (adjusted for mix, mileage, and seasonality) compared to July 2025. The July index is down 1.4% month over month. The long-term average monthly move for July is an increase of 0.4%.
- Non-adjusted wholesale vehicle prices are now up 1.7% year over year, and down 2.6% against June 2026. The long-term average monthly move in non-adjusted values for July is a decrease of 0.7%.
Expert Perspective — Jonathan Gregory, Senior Director, Cox Automotive
“Wholesale values kept normalizing through July, continuing the pattern since the spring bounce peaked in March. The Manheim Index closed the month at 210, down 1.4% from June and about 2.5% below that March high. The year-over-year gain slowed to 1.3%, down from June’s 2.1% — a good chunk is a comp effect as we lap last summer’s tariff-driven climb, but genuine seasonal depreciation is doing more of the work now that we’re fully into summer.
One flag: Gas prices reversed course and moved higher again as July went on, after briefly easing in June. That’s kept demand for used EVs firm even as the broader market cools. EVs held above 4% of all units in the Manheim Index for a second straight period, a share we hadn’t seen before this year. But the EV Index itself decelerated, down 2.1% from June, and its year-over-year gain came in at 10.5%, down from June’s 12%. Non-EV values are essentially flat against last July, up just 0.4%. I wouldn’t call this a reversal yet, but it’s the metric we flagged on our Q2 call to watch, and July is the first month it’s showing up.
The bigger picture is still affordability. Compact cars remain the strongest performer year over year, and the softness we’d confined to SUVs and pickups has spread into midsize cars too. Off-lease maturities kept building. These are a healthy source for dealers’ late-model inventory, but also adding to the depreciation pressure we’re watching into the fall.”
Prices, Retention & Sales Conversion
- MMR prices for the Three-Year-Old Index decreased 2.8% in July.
- MMR retention averaged 99.3%, up 0.1 percentage points year over year and down 0.1 percentage points from June.
- Sales conversion was 54.4% for the period, 0.3 percentage points lower than the most recent three-year average for July and down 2.2 percentage points from the June rate.
Takeaway: MMR prices for the Three-Year-Old Index decreased more than the typical amount for this period. MMR retention fell slightly more than is seasonally normal for this time of year, although from an elevated baseline. Meanwhile, sales conversion indicates demand softening more than is usual for this time of year.
Segment Performance: Year-Over-Year Price Changes
Overall market prices were up from a year ago, led by strength amongst EV and Compact Cars, while Pickups and SUVs are down notably.
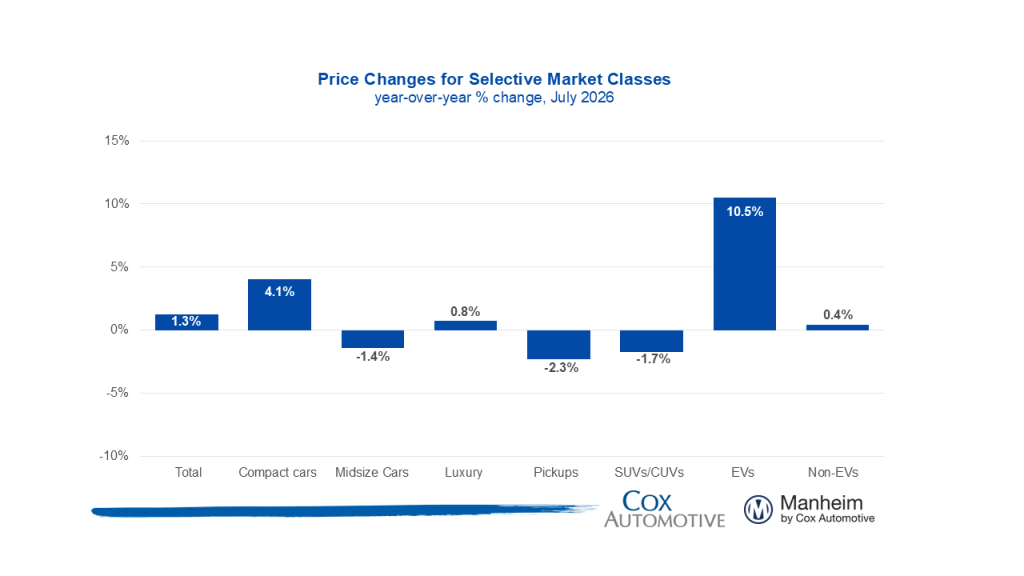
Takeaway: EVs continue to show strong performance, and Compact Cars continue their recent strength.
EV versus Non-EV Index
- EVs: The Electric Vehicle (EV) Index was up 10.5% year over year and down 2.1% from June.
- Non-EVs: The Non-EV Index was up 0.4% year over year and down 1.1% from June.
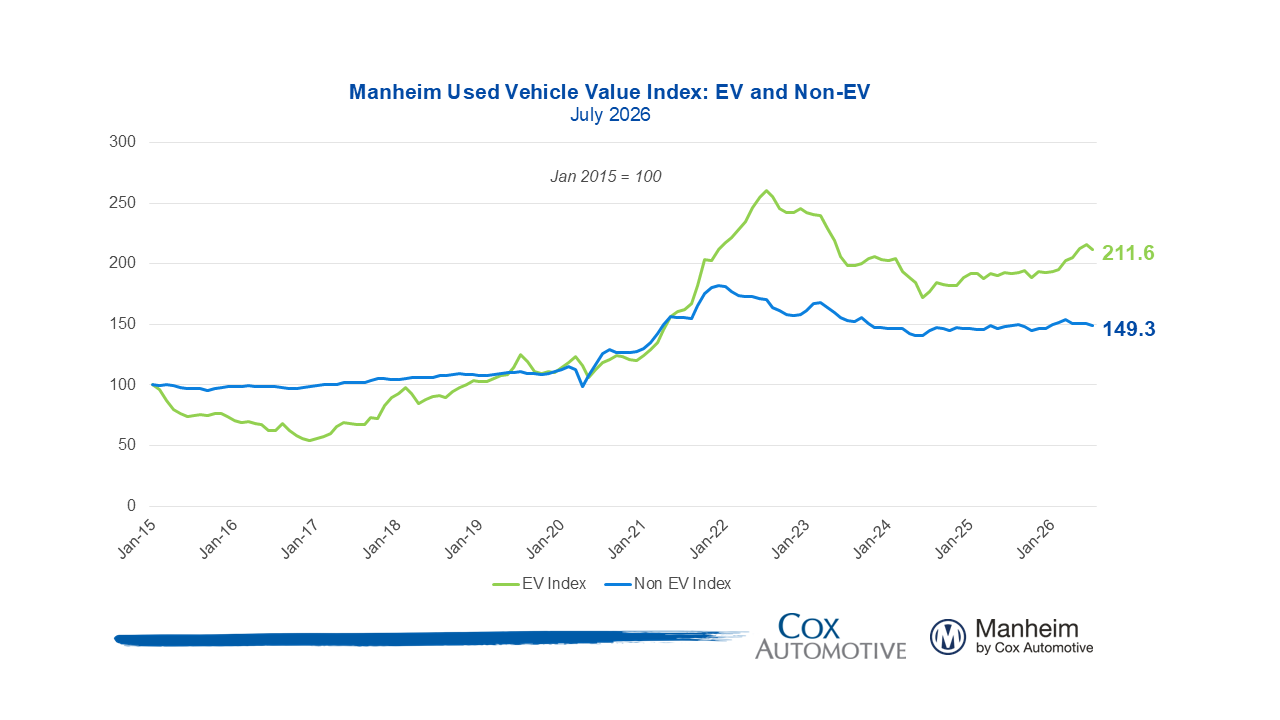
Takeaway: Both EV and Non-EV declined in the past month, but continue to see elevated prices against this time last year, with EVs showing particular strength.
Wholesale Supply & Rental Prices
- Wholesale supply: At the end of July, wholesale days’ supply rose to 28 days, higher by 1.7 days year over year and higher by 0.9 days compared to June.
- Rental prices: Prices for rental vehicles are higher by 6.1% year over year, rising in July, up by 3.5% from June. Rental values on a non-seasonally adjusted basis are 5.5% above 2025’s level and increased 2.7% in July, consistent with lower average mileage, down 2% against last July.
Takeaway: Days’ supply in July was elevated against last year but remains well within seasonal norms. Rental values climbed against June, while average mileage increased month over month.
View historical MUVVI reports here.
For more information on Manheim: VISIT MANHEIM.COM
The Manheim Used Vehicle Value Index (MUVVI) is a trusted benchmark for tracking wholesale used-vehicle prices in the U.S., which helps dealers and analysts gauge market shifts and anticipate retail trends. The official measure is reported on the fifth business day of each month. The next complete suite of monthly MUVVI data will be released on Sept. 8, 2026.
For questions or to request data, please email manheim.data@coxautoinc.com. If you want updates about the Manheim Used Vehicle Value Index, as well as direct invitations to the quarterly call sent to you, sign up for our Cox Automotive newsletter and select Manheim Used Vehicle Value Index quarterly calls.
Note: The Manheim Used Vehicle Value Index was adjusted to improve accuracy and consistency across the data set as of the January 2023 data release. The starting point for the MUVVI was adjusted from January 1995 to January 1997. The index was then recalculated with January 1997 = 100, whereas prior reports had 1995 as the baseline of 100. All monthly and yearly percent changes since January 2015 are identical. Learn more about the decision to rebase the index.