Key Metrics
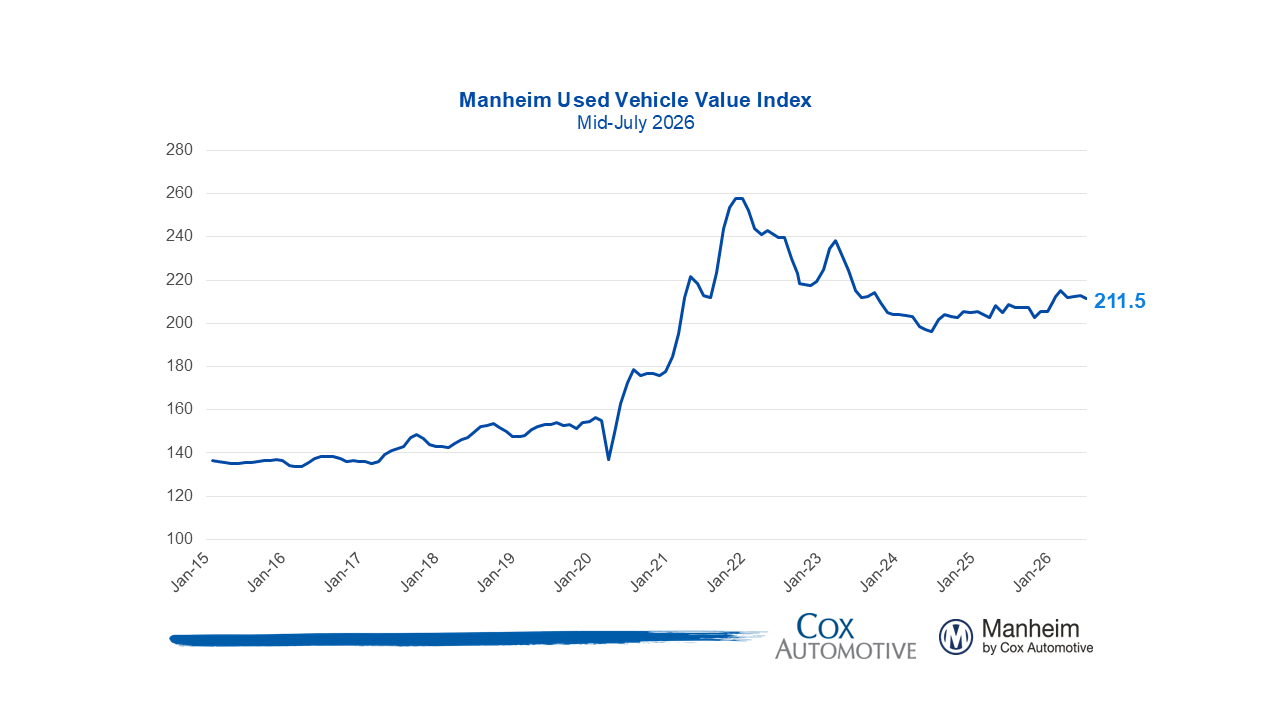
- Manheim Used Vehicle Value Index (MUVVI) fell to 211.5, reflecting a 0.6% decrease in wholesale used-vehicle prices (adjusted for mix, mileage, and seasonality) in the first 15 days of July compared to June. Wholesale values are now higher by 2% compared to July 2025, even as depreciation has been elevated, normalizing the run rate from a strong start.
- Non-adjusted wholesale vehicle prices decreased 1.9% in the first half of July from June and are up 2.4% year over year. The long-term average monthly move in non-adjusted values is typically a decrease of 0.7% for the full month of July.
Expert Perspective — Jeremy Robb, Chief Economist, Cox Automotive
“Wholesale values have been on the decline in the summer after seeing a strong and prolonged Spring Bounce earlier in the year. While depreciation trends are currently running a bit higher than usual, it’s a sign of the market correcting itself back to normal as the MUVVI remains 2% higher against last year’s level. Under the surface, we’ve continued to observe stronger pricing trends in older ‘more affordable’ units as strapped consumers look to offset higher prices in the rest of the economy by shopping for cheaper used vehicles. At the same time, there’s more interest in used electric vehicles, with the segment rising to over 4% of all units driving the Manheim Index value – a level never seen before.
New-vehicle sales have been stronger thus far this summer, as the wealth effect from strong equity markets fuels demand, while used retail sales have stayed flat against the stronger levels from last year. And wholesale inventory is getting a bit of a boost with higher off-lease maturities hitting the market – a good trend for dealers needing to source popular late model product.
Despite the normalization in wholesale valuations, the market is fairly balanced and set up to support dealers as we move into the second half of the year. With gas prices once again on the rise, we expect interest to remain steady for fuel efficient vehicles as consumers look for anything that can provide relief for stretched budgets.”
MMR Prices, Retention & Sales Conversion
- MMR prices for the Three-Year-Old Index were down 1.1% since the beginning of July, considerably weaker than last year’s trend, as tariff impacts supported higher wholesale values. Overall, MMR depreciation was elevated in the first half of July relative to the long-term average.
- MMR retention averaged 99.4% in the first half of July, higher by 0.2 points year over year and flat from June.
- Sales conversion averaged 55.1% in the first half of July, lower by 1 point year over year and down 1.7 points from June.
Takeaway: MMR depreciation has accelerated modestly in early July but remains above year-ago levels. MMR retention is slightly higher than the historical run rate norms, and sales conversion remains above the longer-term run rate, a sign that demand remains strong at Manheim.
Segment Performance: Year-Over-Year Price Changes
Prices in the overall market rose 2% year over year, as compact cars and EVs show continued strength against last year. Against June values, performance is mixed with most segments depreciating.
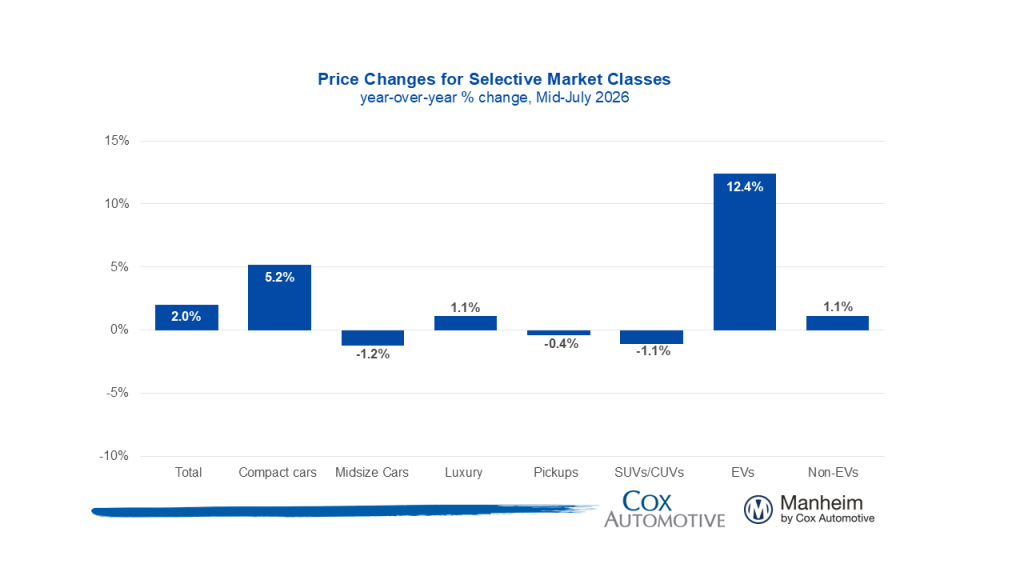
Takeaway: Compact cars and EVs show gains against levels from last year, as fuel costs have remained elevated throughout the spring. Meanwhile SUVs and Pickups have posted declines in wholesale prices against last year.
EV versus Non-EV Index
- EVs: The EV Index was up 12.4% year over year and down 0.4% from June.
- Non-EVs: The Non-EV Index was up 1.1% year over year, and lower by 0.5% against June.
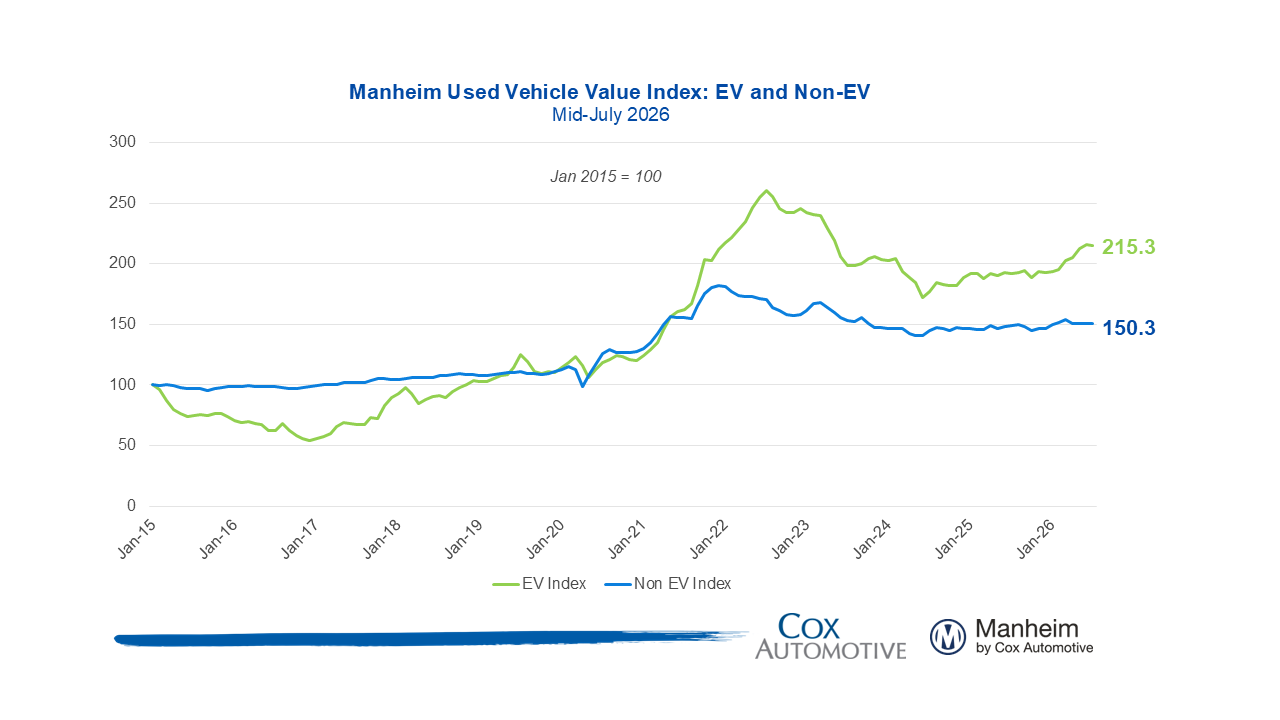
Takeaway: EV values have continued to appreciate in recent months as elevated gas prices have sustained consumer interest, while Non-EV values have held steady thus far in July.
Wholesale Supply
- At the end of June, wholesale vehicle supply reached 27 days, up 1.6 days against June 2025 and up 0.3 days against the end of May. As of July 15th, days’ supply had risen to 28 days and is higher by about 1.5 days against last year.
Takeaway: Wholesale used-vehicle sales have shown modest gains in recent weeks as dealer demand remains solid. However, inventory growth has been outpacing the pickup in sales as we continue to see off-lease supply increase, a trend that will continue through the second half of the year.
View historical MUVVI reports here.
For more information on Manheim, visit Manheim.com.
The Manheim Used Vehicle Value Index (MUVVI) is a trusted benchmark for tracking wholesale used-vehicle prices in the U.S., which helps dealers and analysts gauge market shifts and anticipate retail trends. The official measure is reported on the fifth business day of each month. The next complete suite of monthly MUVVI data will be released on July 8, 2026.
For questions or to request data, please email manheim.data@coxautoinc.com. If you want updates about the Manheim Used Vehicle Value Index, as well as direct invitations to the quarterly call sent to you, please sign up for our Cox Automotive newsletter and select Manheim Used Vehicle Value Index quarterly calls.
Note: The Manheim Used Vehicle Value Index was adjusted to improve accuracy and consistency across the data set as of the January 2023 data release. The starting point for the MUVVI was adjusted from January 1995 to January 1997. The index was then recalculated with January 1997 = 100, whereas prior reports had 1995 as the baseline of 100. All monthly and yearly percent changes since January 2015 are identical. Learn more about the decision to rebase the index.