Key Metrics
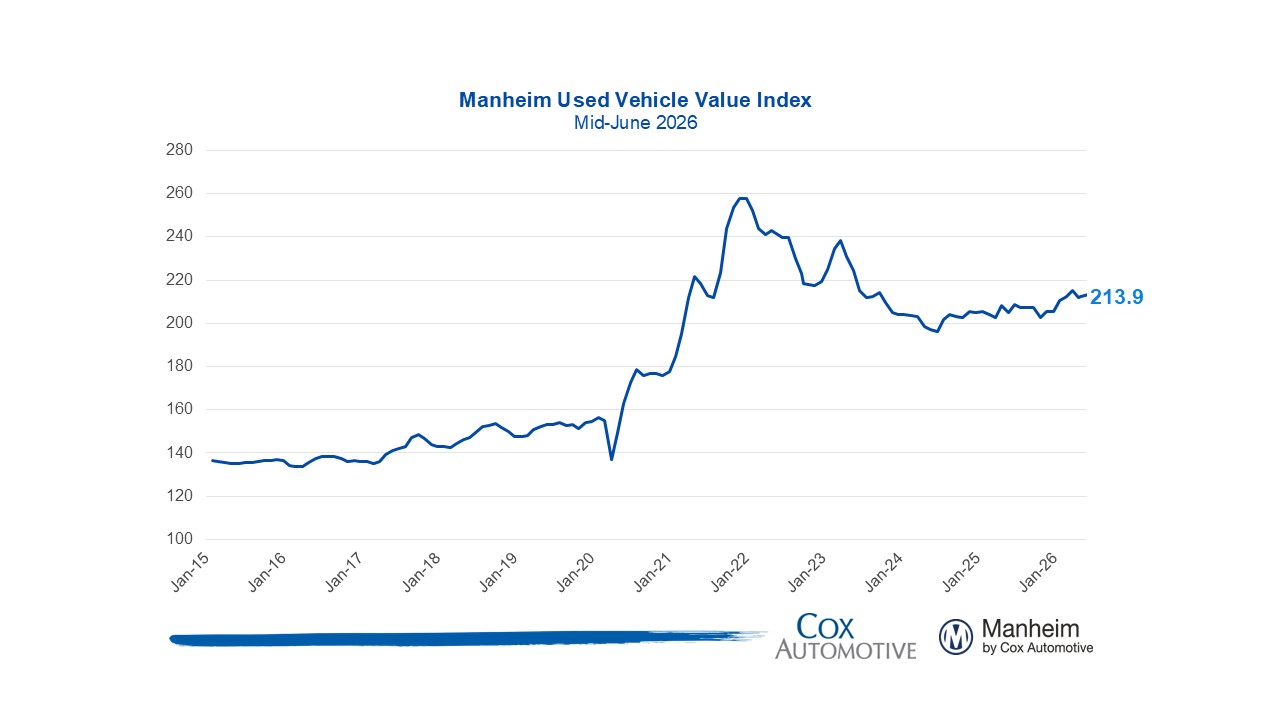
- Manheim Used Vehicle Value Index (MUVVI) increased to 213.9, reflecting a 0.6% increase in wholesale used-vehicle prices (adjusted for mix, mileage, and seasonality) in the first 15 days of June compared to May. Wholesale values are now higher by 2.6% compared to June 2025, with appreciation trends slightly higher than the typical increase of 0.5% over the full month.
- Non-adjusted wholesale vehicle prices decreased 0.8% in the first half of June from May and are up 3.4% year over year. The long-term average monthly move in non-adjusted values is typically a decrease of 0.5% for the full month of June.
Expert Perspective — Jeremy Robb, Chief Economist, Cox Automotive
“Manheim values continue their normal pattern of declining at this time of year, though prices are falling from elevated levels from stronger spring appreciation. The increase in the first half of June is very close to normal seasonal averages for the index, although non-seasonally adjusted prices show slightly higher rates of decay. Certain segments are performing better, as EV’s and compact cars continue to show stronger price appreciation, a sign that affordability may be doing some work behind the scenes.
The conflict in the Middle East appears to be nearing a solution, but it’s too early to see the impact in the rear-view mirror. With gas stockpiles low across much of the globe, energy demand will likely remain stronger for some time. With prices at the pump still over $4.00 in mid-June, those trends will likely continue to weigh on consumer purchasing overall.
Used retail days’ supply is a bit higher against last year, but the tariff impact in 2025 continued to drive demand through the summer. Current days’ supply is well balanced. As we move into the second half of the year, we should continue to see a ramp in both off-lease maturities and the rise of off-lease EV’s within that mix, two factors which are likely to influence the Manheim Index through year end.”
MMR Prices, Retention & Sales Conversion
- MMR prices for the Three-Year-Old Index were down 0.7% since the beginning of June, weaker than last year’s trend, as tariff impacts supported higher wholesale values a year ago. Overall, MMR depreciation in the first half of June was higher than the long-term average.
- MMR retention averaged 99.6% in the first half of June, higher by 0.4 points year over year and up 0.1 point from May.
- Sales conversion averaged 59.4% in the first half of June, higher by 3.7 points year over year but down 0.4 points from May.
Takeaway: Seasonal MMR depreciation trends are now showing, with some groups continuing to perform a bit better than others in early June. MMR retention is a little higher than the historical run rate norms, while sales conversion remains well above the longer-term run rate, a sign that demand remains strong at Manheim.
Segment Performance: Year-Over-Year Price Changes
Prices in the overall market rose 2.6% year over year, as all major segments continue to show gains against last year. Against May values, performance is mixed with larger gains in SUVs, while midsize sedans and trucks are lower.
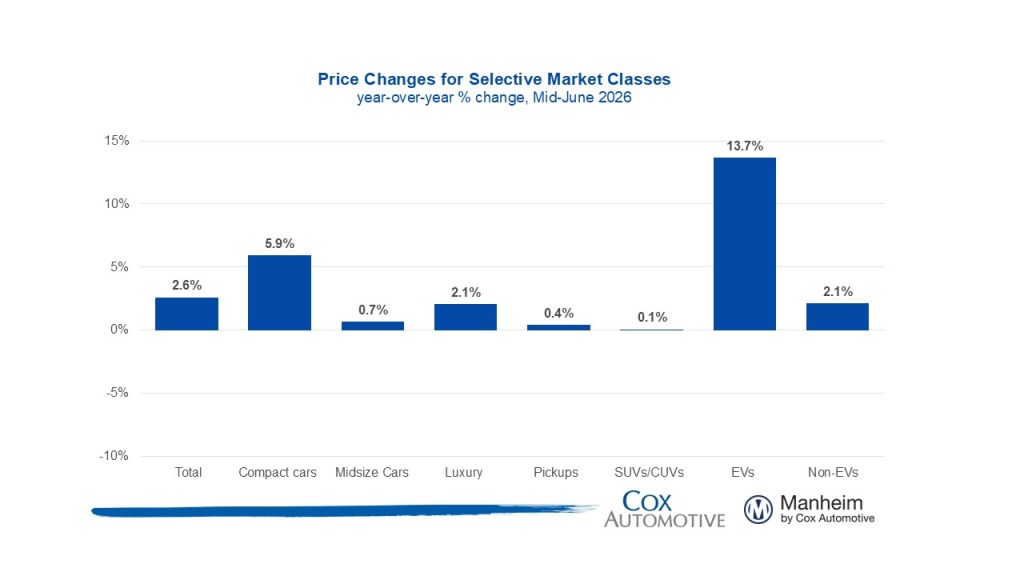
Takeaway: All major segments show gains against levels from last year, but some interesting trends that may be related to affordability concerns are emerging. SUVs continue to show the most growth in mix over the last year, though values in the segment are higher by only 0.1% year over year. Compact cars remain the most affordable segment, though, and show gains that outpace the market overall, rising 5.9% against last year.
EV versus Non-EV Index
- EVs: The EV Index was up 13.7% year over year and up 3.2% from May.
- Non-EVs: The Non-EV Index was up 2.1% year over year, and higher by 0.6% against May.
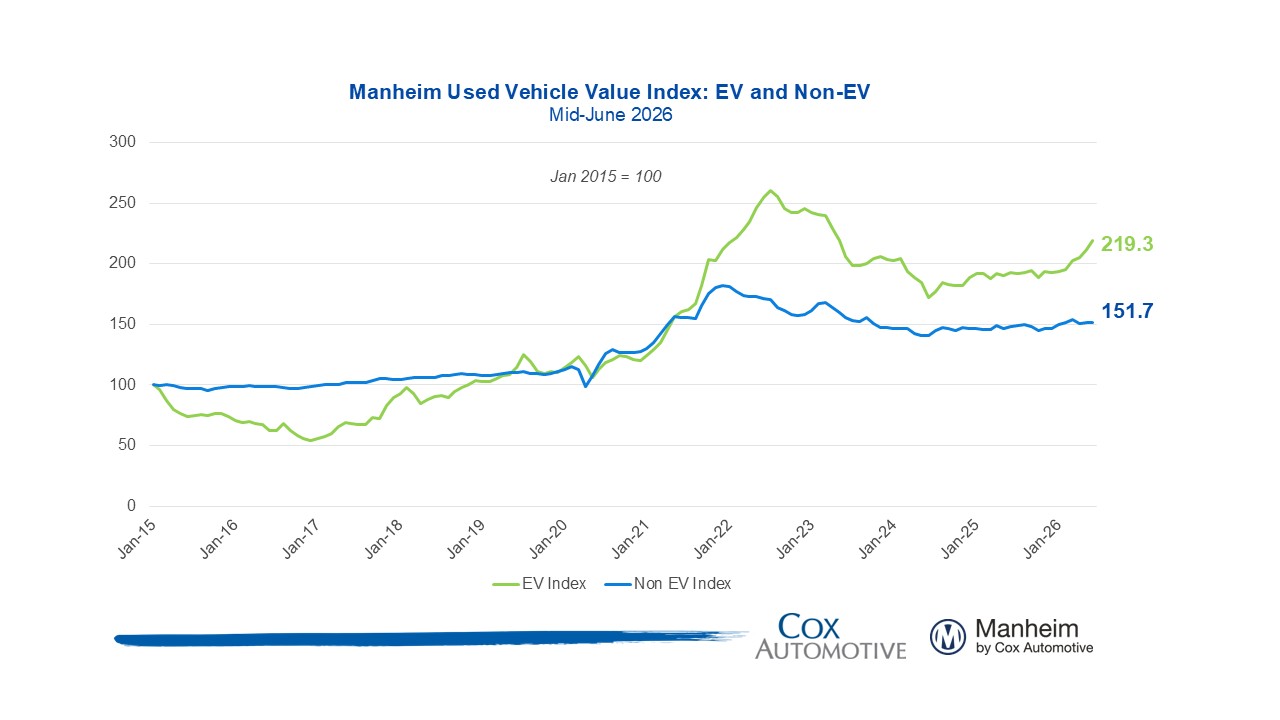
Takeaway: EV values have shown much more appreciation since March as elevated gas prices and relative value have driven more consumer interest. Non-EV values have also shown more resiliency and are higher thus far in June, though underperforming the appreciation seen with EVs.
Wholesale Supply
- At the end of May, wholesale vehicle supply reached 26 days, up 1 day against May 2025 and flat against the end of April. As of June 15, days’ supply had risen to 27 days and is higher by about 1 day against last year.
Takeaway: Wholesale used-vehicle sales slowed marginally against the gain in the pace of supply through the first half of May but are now following seasonally normal trends.
View historical MUVVI reports here.
For more information on Manheim, visit Manheim.com.
The Manheim Used Vehicle Value Index (MUVVI) is a trusted benchmark for tracking wholesale used-vehicle prices in the U.S., which helps dealers and analysts gauge market shifts and anticipate retail trends. The official measure is reported on the fifth business day of each month. The next complete suite of monthly MUVVI data will be released on July 8, 2026.
For questions or to request data, please email manheim.data@coxautoinc.com. If you want updates about the Manheim Used Vehicle Value Index, as well as direct invitations to the quarterly call sent to you, please sign up for our Cox Automotive newsletter and select Manheim Used Vehicle Value Index quarterly calls.
Note: The Manheim Used Vehicle Value Index was adjusted to improve accuracy and consistency across the data set as of the January 2023 data release. The starting point for the MUVVI was adjusted from January 1995 to January 1997. The index was then recalculated with January 1997 = 100, whereas prior reports had 1995 as the baseline of 100. All monthly and yearly percent changes since January 2015 are identical. Learn more about the decision to rebase the index.