Key Metrics
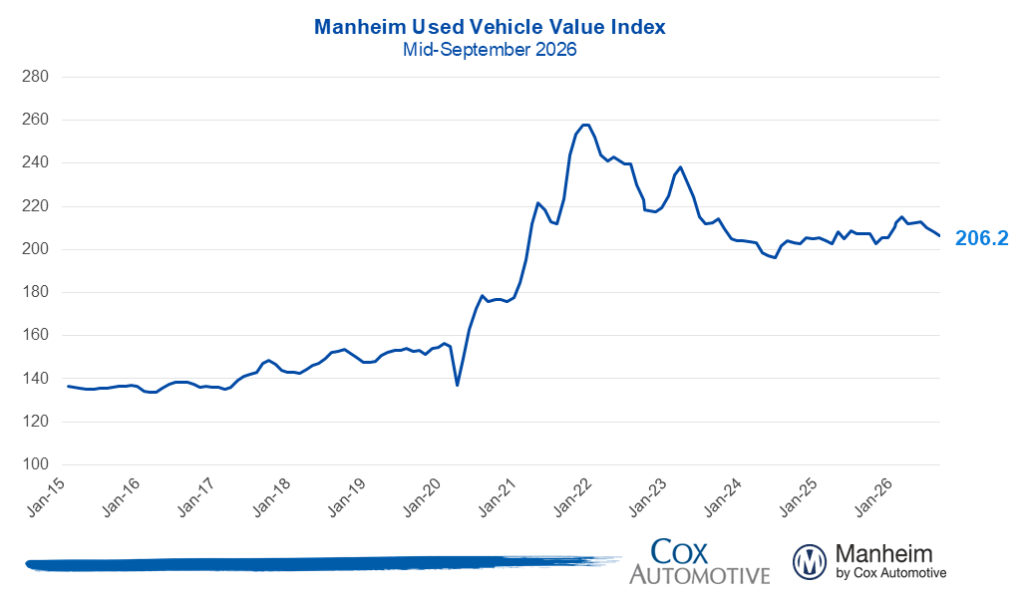
- Manheim Used Vehicle Value Index (MUVVI) fell to 206.2, reflecting a 1% decrease in wholesale used-vehicle prices (adjusted for mix, mileage, and seasonality) in the first 15 days of September compared to August. The Manheim index was down 0.4% compared to September 2025, softening from the elevated levels recorded in the first half of the year.
- Non-adjusted wholesale vehicle prices decreased 1.1% in the first half of September from August and are down 1.1% year over year. The long-term average monthly move in non-adjusted values is typically a decrease of 0.3% for the full month of September.
Expert Perspective — Jonathan Gregory, Senior Director, Cox Automotive
“Wholesale values pulled back in the first half of September, with the Manheim Used Vehicle Value Index falling 1% from August to 206.2, and non-adjusted prices declined 1.1%. That decline is enough to tip the year-over-year comparison negative for the first time in 2026. That is down 0.4% against last September, after decelerating from a stronger-than-normal first half of the year. The market has fully given back the stronger pricing trend from the spring’s tax-refund bounce and is now tracking a touch below last year.
“Following a record-setting Labor Day, gas prices have continued to move higher amid renewed unrest in the Middle East. As of mid-month, Compact Cars and EVs were the only major segments with values above year-ago levels, potentially reflecting greater demand for fuel-efficient vehicles. Still, even EV values are cooling, but less dramatically than the overall market. The EV Index remained above its year-ago level but posted a monthly decline, while non-EV values in mid-September were lower both year over year and from August. Wholesale supply is drifting higher, up 2.4 days year over year, to 27.8 days.
“The Federal Reserve’s first rate hike in more than three years adds another potential headwind. The direct impact on auto loans may be limited because those rates tend to track longer-term Treasury yields more closely than the federal funds rate. Still, higher borrowing costs and added pressure on household budgets will weigh on vehicle demand.”
MMR Prices, Retention & Sales Conversion
- MMR prices for the Three-Year-Old Index declined 0.8% since the beginning of September, a sharper decline than the same period last year. Overall, MMR depreciation was slightly elevated in the first half of September relative to the long-term average, consistent with the broader give-back from the spring bounce and softer demand for larger, less fuel-efficient vehicles.
- MMR retention averaged 99.6% in the first half of September, higher by 0.6 points year over year and up 0.1 points from August.
- Sales conversion averaged 55.8% in the first half of September, lower by 1.4 points year over year and down 0.7 points from August.
Takeaway: MMR retention remained near the upper end of its seasonal range, while sales conversion, a key indicator of demand, was softer than both August and last year.
Segment Performance: Year-Over-Year Price Changes
Overall wholesale values were lower year over year, as gains for Compact Cars and EVs were more than offset by declines in Midsize Cars, Pickups, and SUVs.
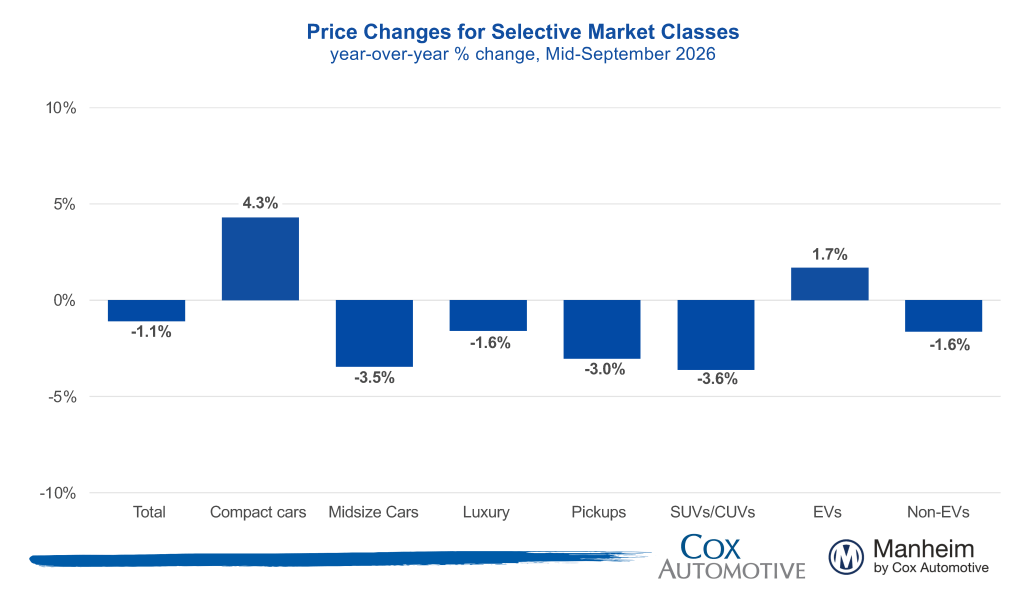
Takeaway: With fuel prices dominating the national headlines, Compact Cars and EVs values remained above year-ago levels, although both have lost momentum in recent months. Values for larger, less fuel-efficient segments were lower than a year ago.
EV versus Non-EV Index
- EVs: The EV Index was up 2.3% year over year and down 1.3% from August.
- Non-EVs: The Non-EV Index was down 1.3% year over year, and lower by 1.4% against August.
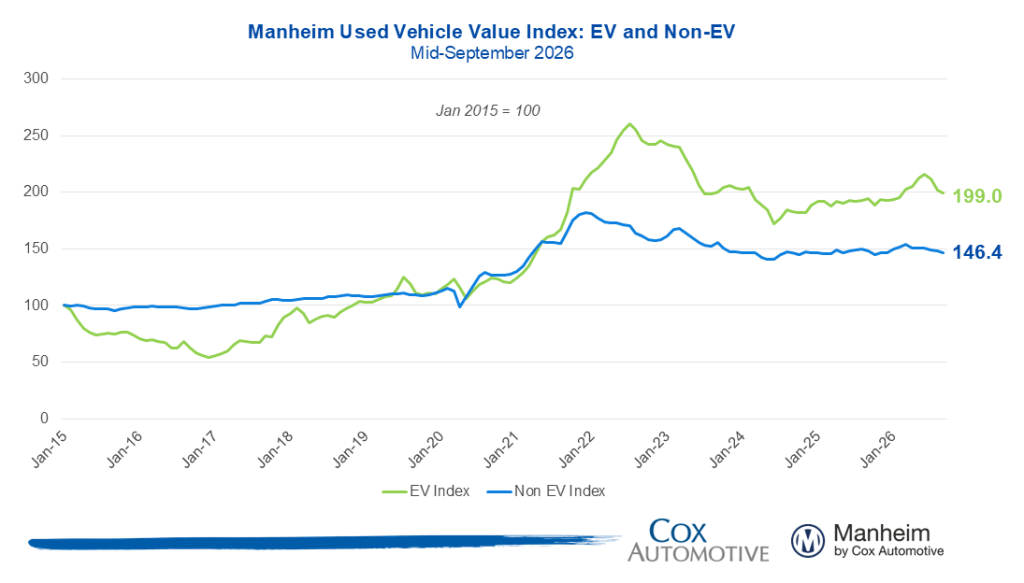
Takeaway: EV values continued to decline from their elevated spring baseline as availability improves.
Wholesale Supply
- At the end of August, wholesale vehicle supply reached 27.2 days, up 2.5 days against August 2025 and down 1.2 days against the end of July. As of Sept. 15, days’ supply had risen to 27.8 days and is higher by about 2.4 days against last year.
Takeaway: Wholesale used-vehicle days’ supply has increased in the first half of September.
View historical MUVVI reports here.
For more information on Manheim, visit Manheim.com.
The Manheim Used Vehicle Value Index (MUVVI) is a trusted benchmark for tracking wholesale used-vehicle prices in the U.S., which helps dealers and analysts gauge market shifts and anticipate retail trends. The official measure is reported on the fifth business day of each month. The next complete suite of monthly MUVVI data will be released on Oct. 7, 2026.
Cox Automotive is transitioning the quarterly Manheim Used Vehicle Value Index Call from a scheduled live event to a prerecorded, on-demand content release. The Q3 2026 MUVVI Update and its supporting materials are scheduled for general release on Wednesday, Oct. 7, at 9 a.m. EDT. Sign up to be notified.
For questions or to request data, please email manheim.data@coxautoinc.com. If you want updates about the Manheim Used Vehicle Value Index, as well as direct invitations to the quarterly call sent to you, please sign up for our Cox Automotive newsletter and select Manheim Used Vehicle Value Index quarterly calls.
Note: The Manheim Used Vehicle Value Index was adjusted to improve accuracy and consistency across the data set as of the January 2023 data release. The starting point for the MUVVI was adjusted from January 1995 to January 1997. The index was then recalculated with January 1997 = 100, whereas prior reports had 1995 as the baseline of 100. All monthly and yearly percent changes since January 2015 are identical. Learn more about the decision to rebase the index.