Key Metrics
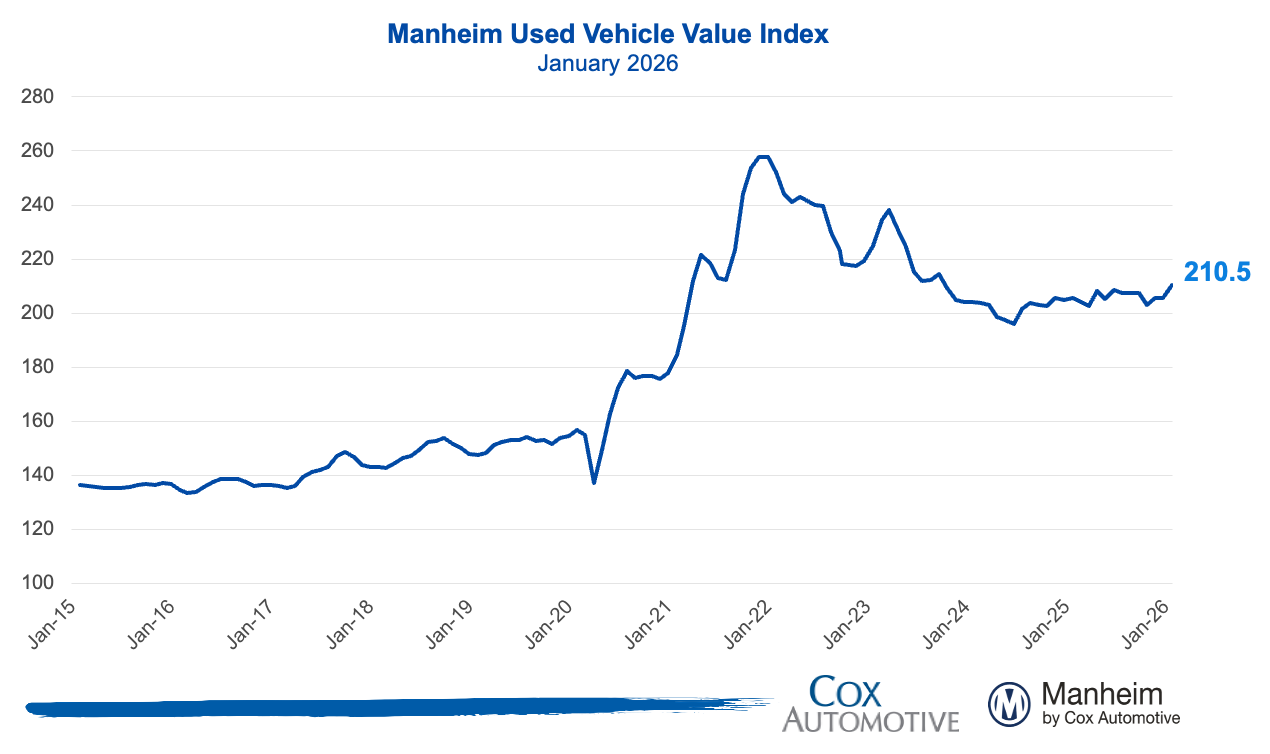
- The Manheim Used Vehicle Value Index (MUVVI) rose to 210.5, reflecting a 2.4% increase for wholesale used-vehicle prices (adjusted for mix, mileage, and seasonality) compared to January 2025. Month over month, the index is up 2.4% in January. The long-term average monthly move is a decrease of 0.2%.
- Non-adjusted wholesale vehicle prices are now up 2.5% year over year, and up 2.7% against December 2025. The long-term average monthly move in non-adjusted values is an increase of 0.4% in January.
Expert Perspective — Jeremy Robb, Chief Economist, Cox Automotive
“We had planned for a stronger January from a pricing perspective, but wholesale values moved even faster than we expected on the back of strong retail demand, driving the MUVVI to its highest reading since September 2023. With tax refund season officially starting last week, we are expecting that more consumers will be getting refunds – and that the size of those refunds will hit a new record. Those factors should help consumers punch the ticket on some big-ticket purchases, even as we have seen a more muted impact on market interest rates in the face of three Fed cuts since September. The spring bounce for wholesale markets looks like it started early this year, and stronger tax refunds and lower used supply may keep it running for longer than typically seen.”
MMR Prices, Retention & Sales Conversion
- MMR prices for the Three-Year-Old Index increased 1.5% in January.
- MMR retention averaged 100.0% in January, up 20 basis points year over year, and up 0.4 percentage points from December.
- Sales conversion was 60.7% for the period, 3.2 percentage points higher than the most recent three-year average for January and up 6.5 percentage points from December.
Takeaway: MMR prices for the Three-Year-Old Index increased more than is typical for this period. MMR retention increased slightly and remains seasonally normal for this time of year. Meanwhile, sales conversion indicates strengthening demand, as the metric remains above usual levels for this time of year.
Segment Performance: Year-Over-Year Price Changes
Overall market prices were up somewhat from a year ago, led by the luxury segment and non-electric vehicles, while compact cars posted slight declines.
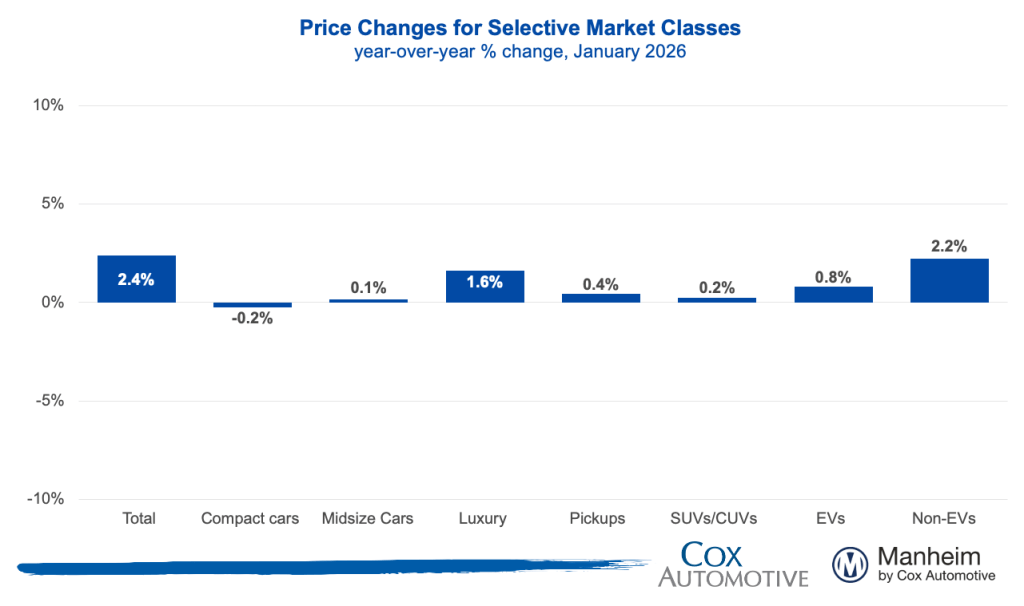
Takeaway: Most vehicle segments are slightly above year-earlier levels; however, the luxury segment continues to outperform the overall market. We have observed the strength in this segment throughout the last year. Compact and midsize cars continue to see relatively weak price growth compared to this time last year.
EV versus Non-EV Index
- EVs: The Electric Vehicle (EV) Index was up 0.8% year over year and up 0.4% from December.
- Non-EVs: The Non-EV Index was up 2.2% year over year and also higher by 2.2% from December.
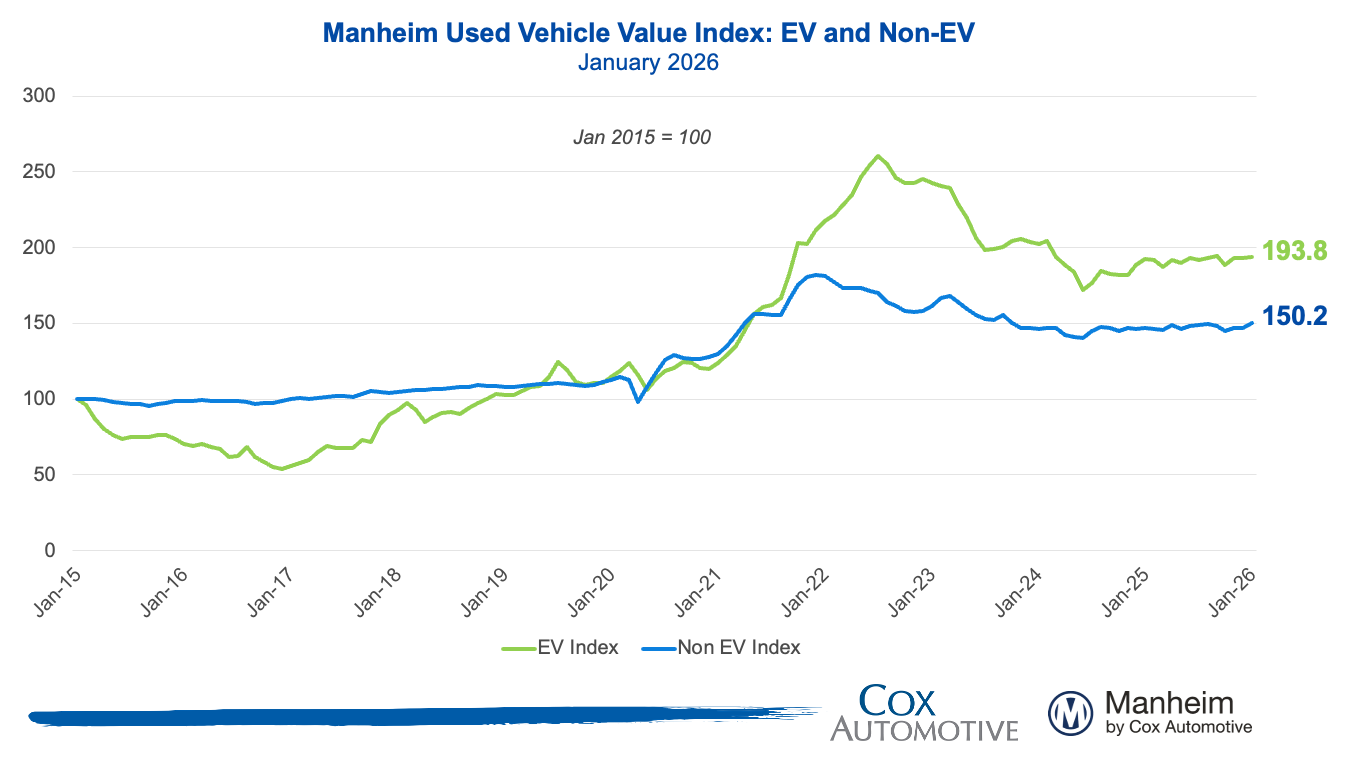
Takeaway: With the expiration of government-backed EV incentives, prices moderated, but remain slightly higher than a year ago, when EV values saw much more depreciation in the first half of the year.
Wholesale Supply and Rental Prices
- Wholesale supply: At the end of January, wholesale days’ supply fell to 26.6 days, lower by 0.3 days year over year and lower by 5.1 days compared to December.
- Rental prices: Prices for rental vehicles are higher by 2.4% year over year, as they fell slightly in January, down by 0.3% from December. Rental values on a non-seasonally adjusted basis are 2.7% above 2025’s level and rose 0.6% in January, driven by lower average mileage, down 19% against last January overall.
Takeaway: Before the pandemic, wholesale vehicle days’ supply averaged 32 days at the end of January. Days’ supply in January was lower than historical norms but experienced a seasonally typical decline from December.
View historical MUVVI reports here.
For more information on Manheim, visit Manheim.com.
For more information on the Manheim Used Vehicle Value Index, visit Manheim Insights.
Register for the Q1 MUVVI call
on Tuesday, April 7, at 11 a.m. EDT.
The Manheim Used Vehicle Value Index (MUVVI) is a trusted benchmark for tracking wholesale used-vehicle prices in the U.S., which helps dealers and analysts gauge market shifts and anticipate retail trends. The official measure is reported on the fifth business day of each month. The mid-month MUVVI number is a checkpoint number, is not an official reading and should not be compared to the official index reading. The mid-month is not a flash estimate, and it is not meant to provide any directional estimate of what the full month number will be. The next complete suite of monthly MUVVI data will be released on Friday, March 6, 2026. Register for the Q1 MUVVI call scheduled for Tuesday, April 7, at 11 a.m. EDT.
For questions or to request data, please email manheim.data@coxautoinc.com. If you want updates about the Manheim Used Vehicle Value Index, as well as direct invitations to the quarterly call sent to you, please sign up for our Cox Automotive newsletter and select Manheim Used Vehicle Value Index quarterly calls.
Note: The Manheim Used Vehicle Value Index was adjusted to improve accuracy and consistency across the data set as of the January 2023 data release. The starting point for the MUVVI was adjusted from January 1995 to January 1997. The index was then recalculated with January 1997 = 100, whereas prior reports had 1995 as the baseline of 100. All monthly and yearly percent changes since January 2015 are identical. Learn more about the decision to rebase the index.