Data Point
Wholesale Price Trend Reverses Course in August
Wednesday September 8, 2021
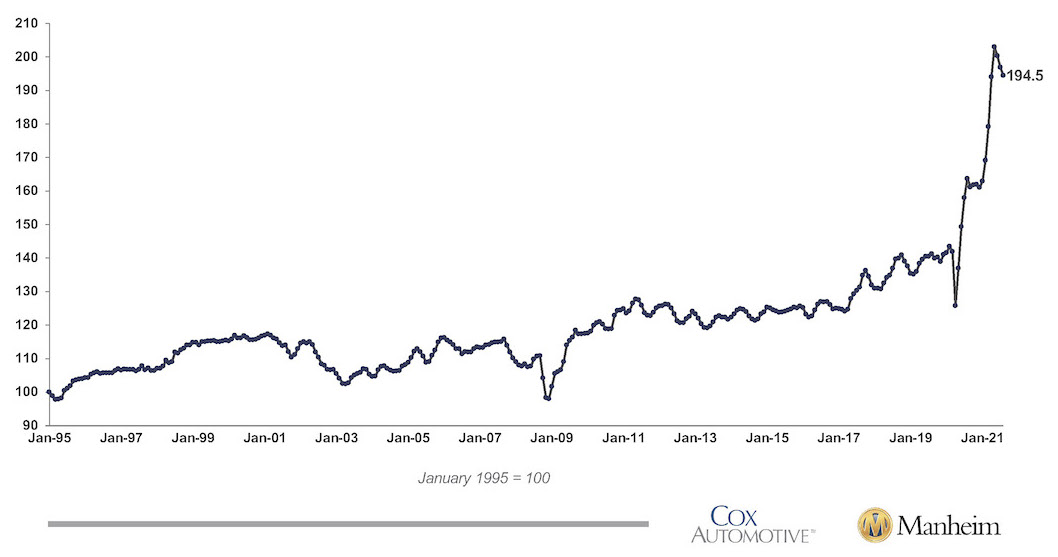
Wholesale used vehicle prices (on a mix-, mileage-, and seasonally adjusted basis) decreased 0.4% month over month in August. This brought the Manheim Used Vehicle Value Index to 194.5, an 18.8% increase from a year ago. The seasonal adjustment caused the monthly decline as the non-seasonally adjusted average price increased 1.4% in August, which left unadjusted prices up 19.9% year over year. In recent years, August has seen large vehicle value increases, which is why the seasonal adjustment is producing the lower value when the market is seeing real prices rise.
Manheim Market Report (MMR) values saw changing trends in August that resulted in stable prices and then accelerating weekly increases. Over the last four weeks, the Three-Year-Old Index increased a net 2.1%. Over the month of August, MMR Retention, which is the average difference in price relative to current MMR, averaged 100%; but the first weekday of the month saw 98.8% retention, while the final weekday saw 100.9% retention, which means that market prices are now ahead of MMR values when they started the month below. The sales conversion rate also increased over the course of the month and ended the month at a level higher than what is typical for August. This indicates that buyers have become more aggressive than the behavior we saw in June and July.
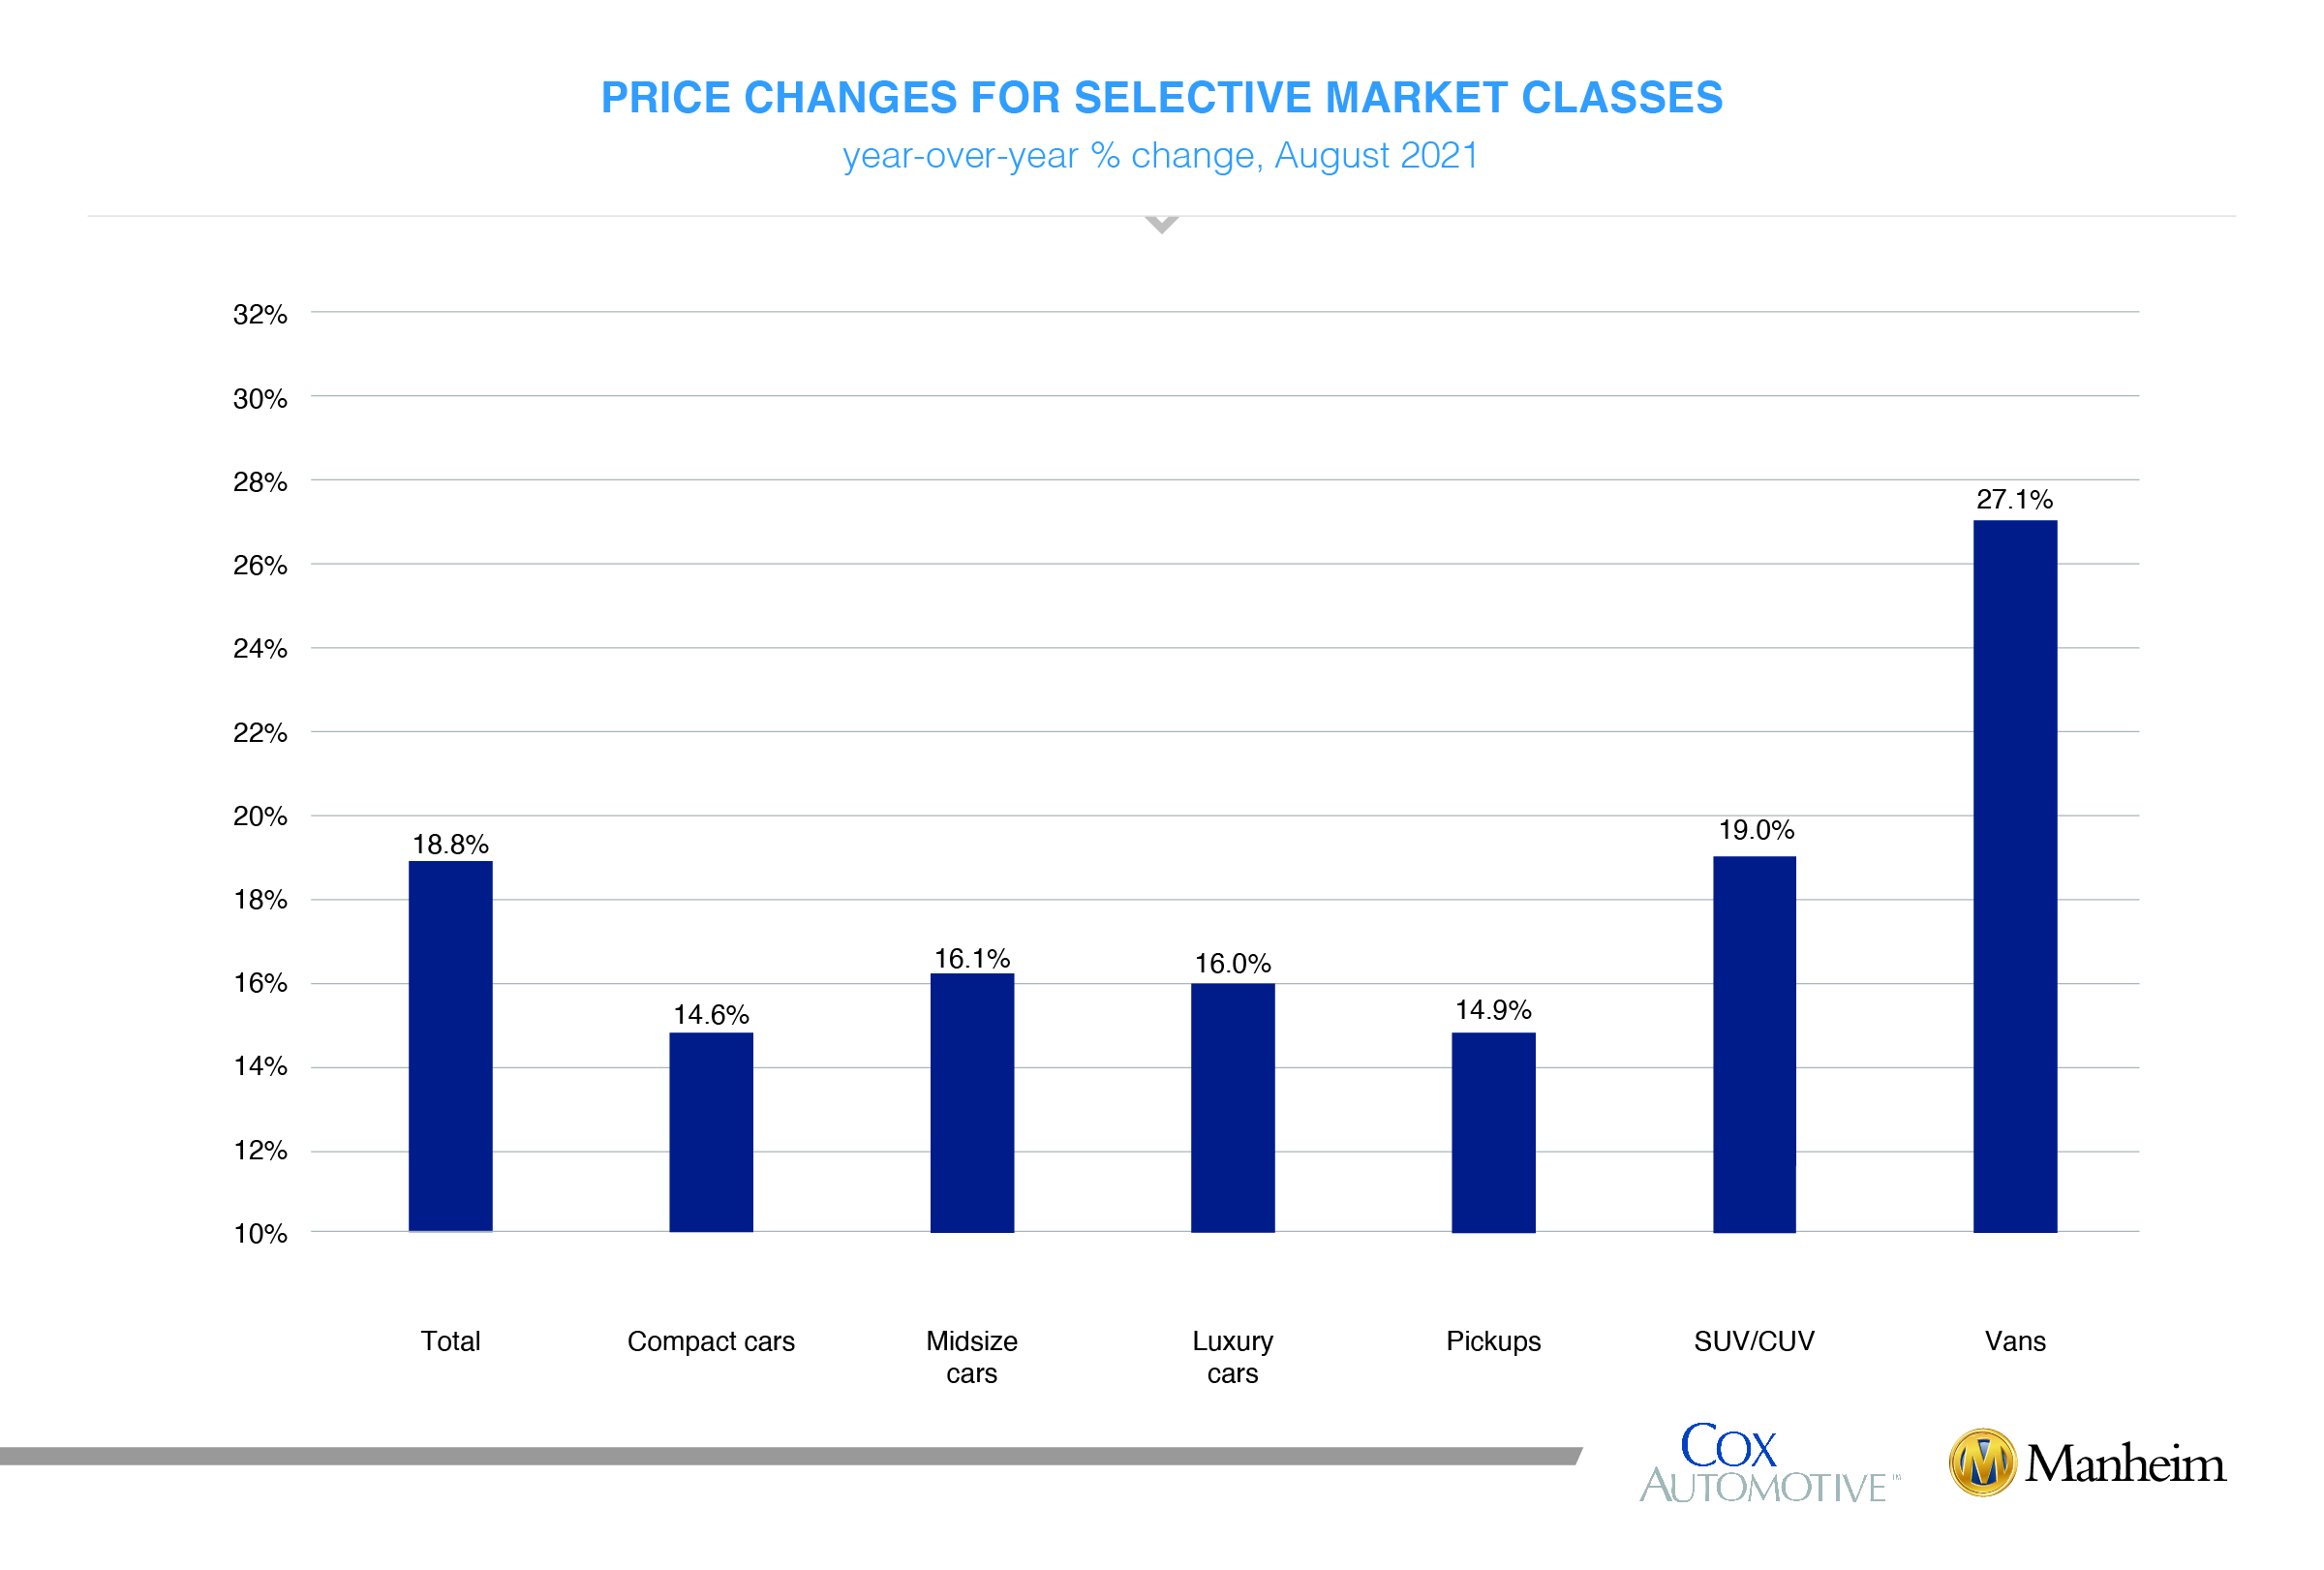
On a year-over-year basis, all major market segments saw seasonally adjusted price increases in August. Vans and sport utility vehicles had the largest year-over-year performance, while the remaining car and pickup segments lagged the overall market. On a month-over-month basis, the compact car and pickup segments saw declines, while the remaining segments saw modest growth.
Vehicle sales fall. According to Cox Automotive estimates, total used vehicle sales were down 12% year over year in August. We estimate the August used SAAR to be 36.7 million, down from 41.6 million last August and flat compared to July’s 36.7 million SAAR. The August used retail SAAR estimate is 20.1 million, down from 22 million last year and flat month over month.
Using a rolling seven-day estimate of used retail days’ supply based on vAuto data, we see that used retail supply peaked at 114 days on April 8, 2020. Normal used retail supply is about 44 days’ supply. It ended August at 40 days, which is below normal levels. We estimate that wholesale supply peaked at 149 days on April 9, 2020, when normal supply is 23. It ended August at 19 days.
August total new vehicle sales were down 17% year over year, with one less selling day compared to August 2020. Month over month, August new vehicle sales were down 15%. The August SAAR came in at 13.1 million, a decrease from last year’s 15.2 million and August 2019’s 17.1 million rate.
Combined sales into large rental, commercial, and government buyers were up 11% year over year in August. Sales into rental increased 118% year-over-year in August and are up 7% compared to the same time period last year. Commercial sales are down 4% year-over-year in August and are up 17% year-to-date 2021 versus 2020. Including an estimate for fleet deliveries into the dealer and manufacturer channel, we estimate that the remaining retail sales were down 19% year over year in August, leading to an estimated retail SAAR of 11.5 million, which was down from 13.0 million last August and down from August 2019’s 13.8 million rate.
Rental risk pricing rises. The average price for rental risk units sold at auction in August was up 18% year-over-year. Rental risk prices were up 13% compared to July. Average mileage for rental risk units in August (at 70,00 miles) was up 78% compared to a year ago but down 20% month-over-month.
August brings clear declines in consumer sentiment. Consumer Confidence according to the Conference Board declined 9.0% in August and left confidence down 14.2% compared to February 2020. Plans to purchase a vehicle in the next six months declined to the lowest level in three months but remained higher than a year ago. Plans to purchase a home also declined to the lowest level in three months and were unchanged year-over-year. Measures of consumer sentiment from the University of Michigan and the index of consumer sentiment from Morning Consult also showed declines in August. The Morning Consult index declined 5.5% in July and ended August down another 3.1%. That left sentiment down 19.5% from Feb. 29, 2020.
The complete suite of monthly MUVVI data is released on the fifth business day of the month. If you have any questions regarding the Index, please contact the Cox Automotive Industry Insights team at Manheim.Data@coxautoinc.com.