
As we roll toward the end of 2019, the industry doomsayers have been quietly predicting the end of the happy days of 17-million-plus SAAR, and yet consumers continue to buy and lease cars at a rate contrary to these dire predictions. November was a great example, with an annualized trend of 17.1 million, the 6th time this year we marked a pace above 17 million. If December delivers healthy sales, 2019 will be the 5th straight year north of 17 million.
Why is this happening?
All indicators point toward a saturated, post-peak marketplace right now. Our streak of hot sales since 2015 has put more than 85 million new cars onto the road in the past 5 years. Yes, affordability continues be an issue, with MSRPs rising, interest rate pressure and longer loan terms. Each month, roughly 300 different models vie in the market for sales. Astonishingly, 50% of volume typically derives from just 30 models. What then is keeping the remaining choices moving—and the volume healthy—month after month, year after year?
A healthy dose of incentives is sure helping. The five-year running average of new-vehicle incentives as a percentage of average transaction price (ATP) is 10.3%. Through November, the 2019 year–to–date average is sitting at 10.72%. Notably, many brands have run above 13% over the past 5 years. Traditionally, 10% has been the typical tripwire for excessive incentives spending, and yet we are well beyond that metric and have been since the industry set an all-time sales record in 2016. These new levels near 11% of ATP may now be the new norm.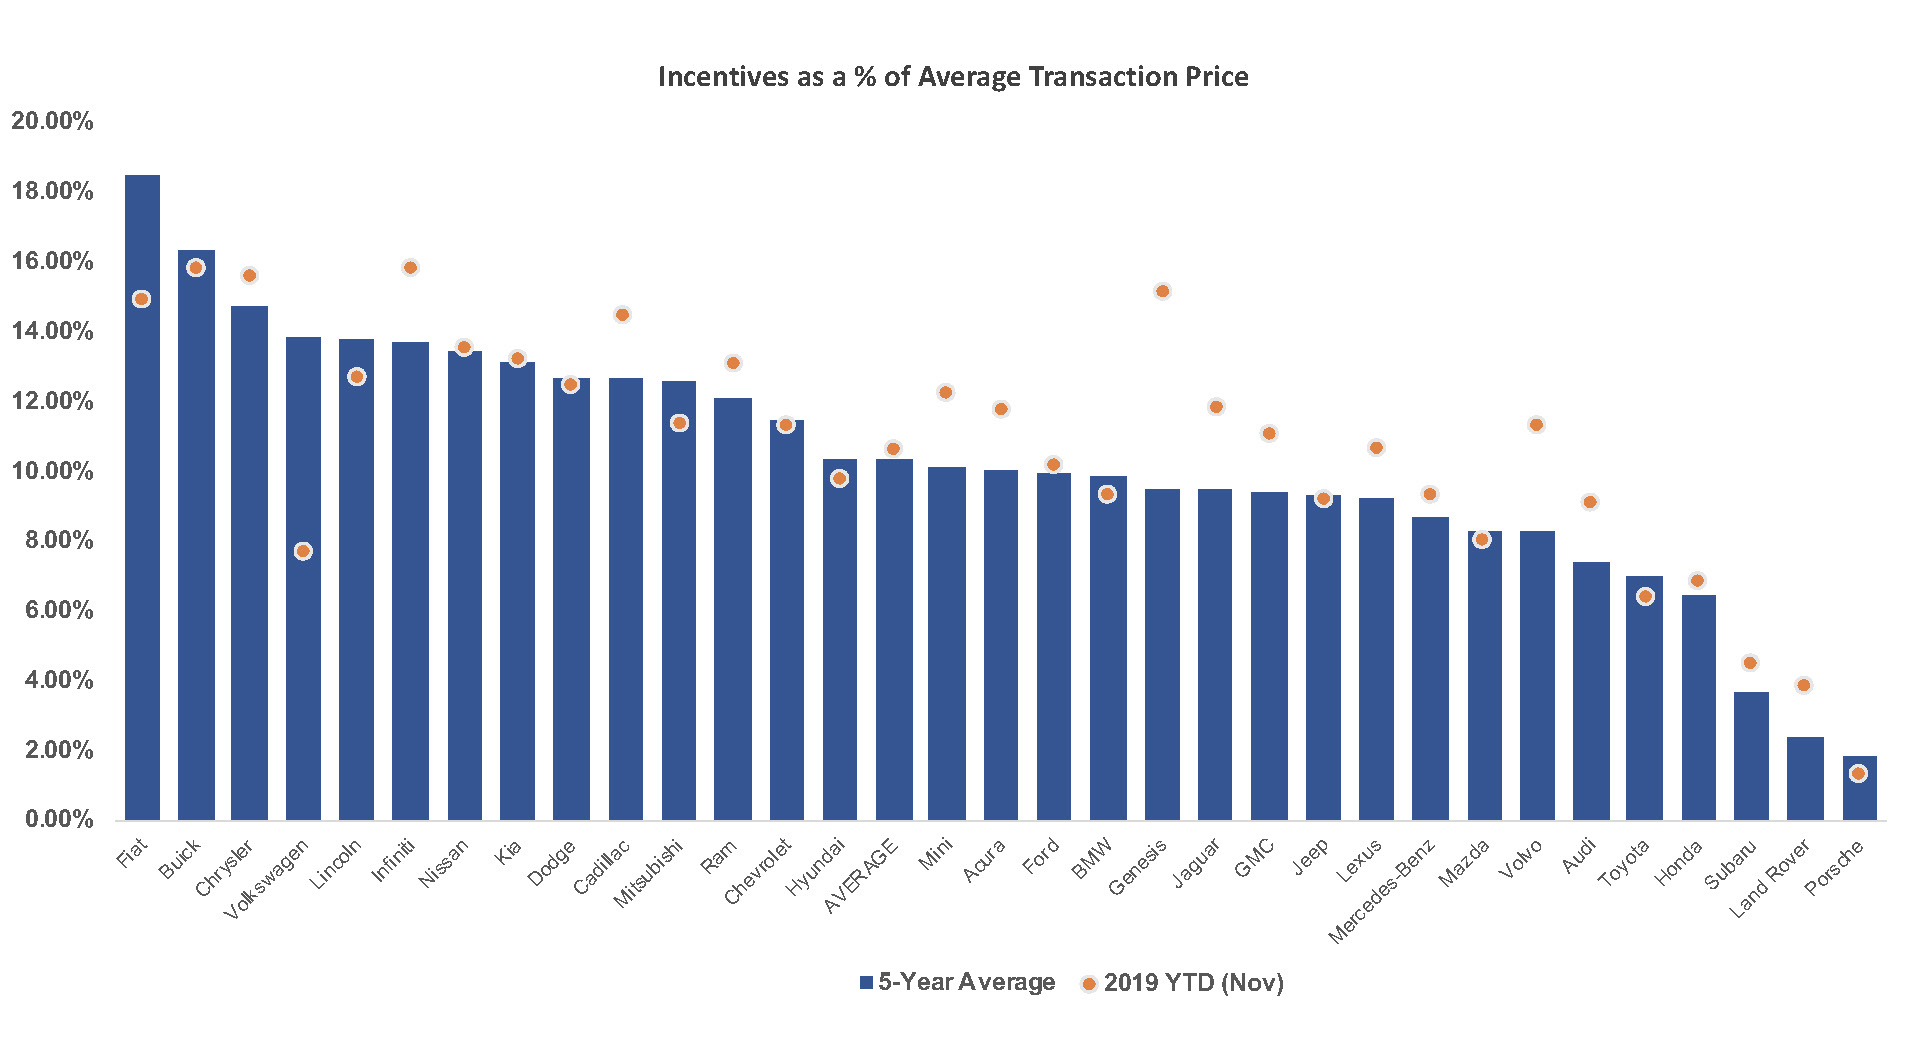 New and relaunched forms of incentive programs have entered the fray recently, including examples such as “Employee Pricing For All” and “% Off MSRP.” In some instances, the combined special/conditional offers available to buyers has well exceeded the headline program savings thanks to a multiple of factors including dealer participation and consumer qualifications. Making sense of all of this is where Cox Automotive Rates & Incentives comes in, as the perceived best offer at the start may not be the actual best value for the consumer, once all purchase and financing structures are considered.
This indeed will be a “December to Remember,” a month that caps another year of historically high incentives in terms of program volume and a near-record of incentive spend as a percentage of ATP. In a saturated market, higher incentives may be the new norm, so it is imperative that all program options are clearly presented to the consumer. And it’s important for the industry to understand what incentives work best—the real value-add incentives that motivate consumers to buy and help OEMs and dealers move the metal.
Download incentives data file.
Todd Somerville is practice leader at Cox Automotive Rates & Incentives. The Cox Automotive Rates & Incentives (CAR&I) team has developed a methodology for measuring the accuracy of data used to calculate pricing and payment information presented through dealer service provider tools (e.g., dealer websites, inventory management, digital retailing & advertising, desking, equity, etc.). Approximately 17,500 individual dealerships – rooftops, in automotive parlance – in the U.S. rely on CAR&I incentive data for powering 5 different software applications through Cox Automotive native software/sites and our many industry partners. In all, an estimated 87,000 applications are relying on CAR&I data in a given month, providing valuable information to 40 million shoppers.


