
It is important to look at average days in inventory for retail used vehicles because as used retail inventory ages, dealers begin to slow wholesale purchases. We took a look back at used-vehicle inventory levels over the past three years.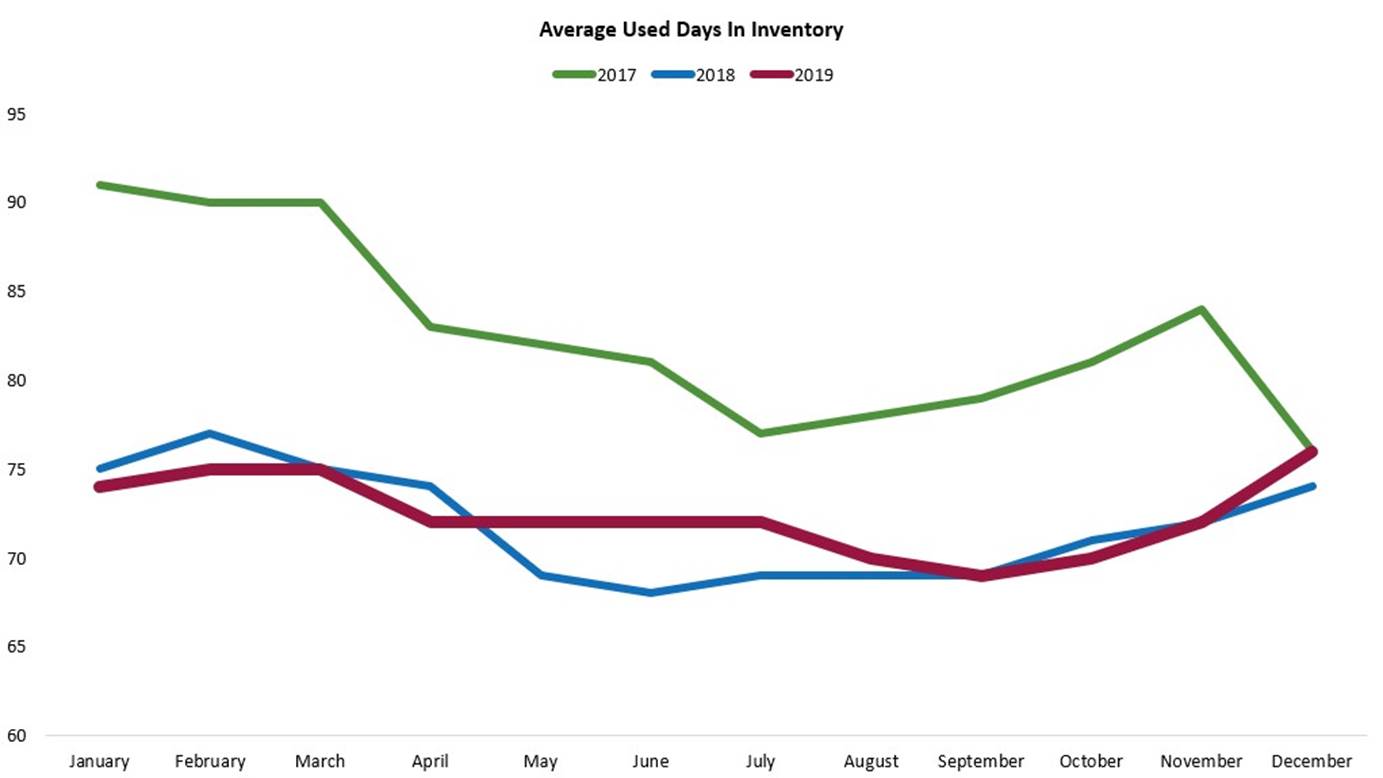
2019 started with the lowest days in inventory in January with 74 days and ended the year on par with 2017 at 76 days in inventory. Compared to 2018, 2019 average days in inventory had more stability in the summer with a decrease in September to 69 days, the lowest for the year.
Last year started similarly to 2018, but as we entered late spring and early summer, 2019 wasn’t moving as fast as the previous year. Average days in inventory picked up slightly at year end to 76 days compared to 74 days in 2018 but remained on par with December 2017.
2017 began with the most days in dealer inventory for used vehicles, for all three years, with the month of January having an average of 91 days as measured by vAuto and illustrated in the chart above. After beginning the year at higher levels, 2017 saw declining age until the end of the year. Year-over-year comparison for 2017 and 2018 shows rapid increase in demand. Specifically, within the spring and summer months of 2018, the average days in inventory was ranging between 65 and 70 days.
2017 saw declining days in inventory for used vehicles until the end of the year whereas 2018 saw age declining rapidly year over year consistent with what the market saw in price dynamics.
See the latest on the Manheim Used Vehicle Value Index to learn more about wholesale vehicle values.


