
Average transaction prices (ATPs) in January started off 2020 much like they ended 2019: rising. The market saw a 3.5% year-over-year gain in January, to nearly $38,000. The gain was driven mostly by a heavier truck/SUV sales mix, as car share fell to 25% in January, down from 30% in January 2019. Both trucks and SUVs gained, as trucks rose to 19% of the market (up from 17% from January 2019), and SUVs climbed to 52% (up from 48%). Had the sales mix remained steady from a year ago, the year-over-year increase in ATPs would have only been about 1.5%.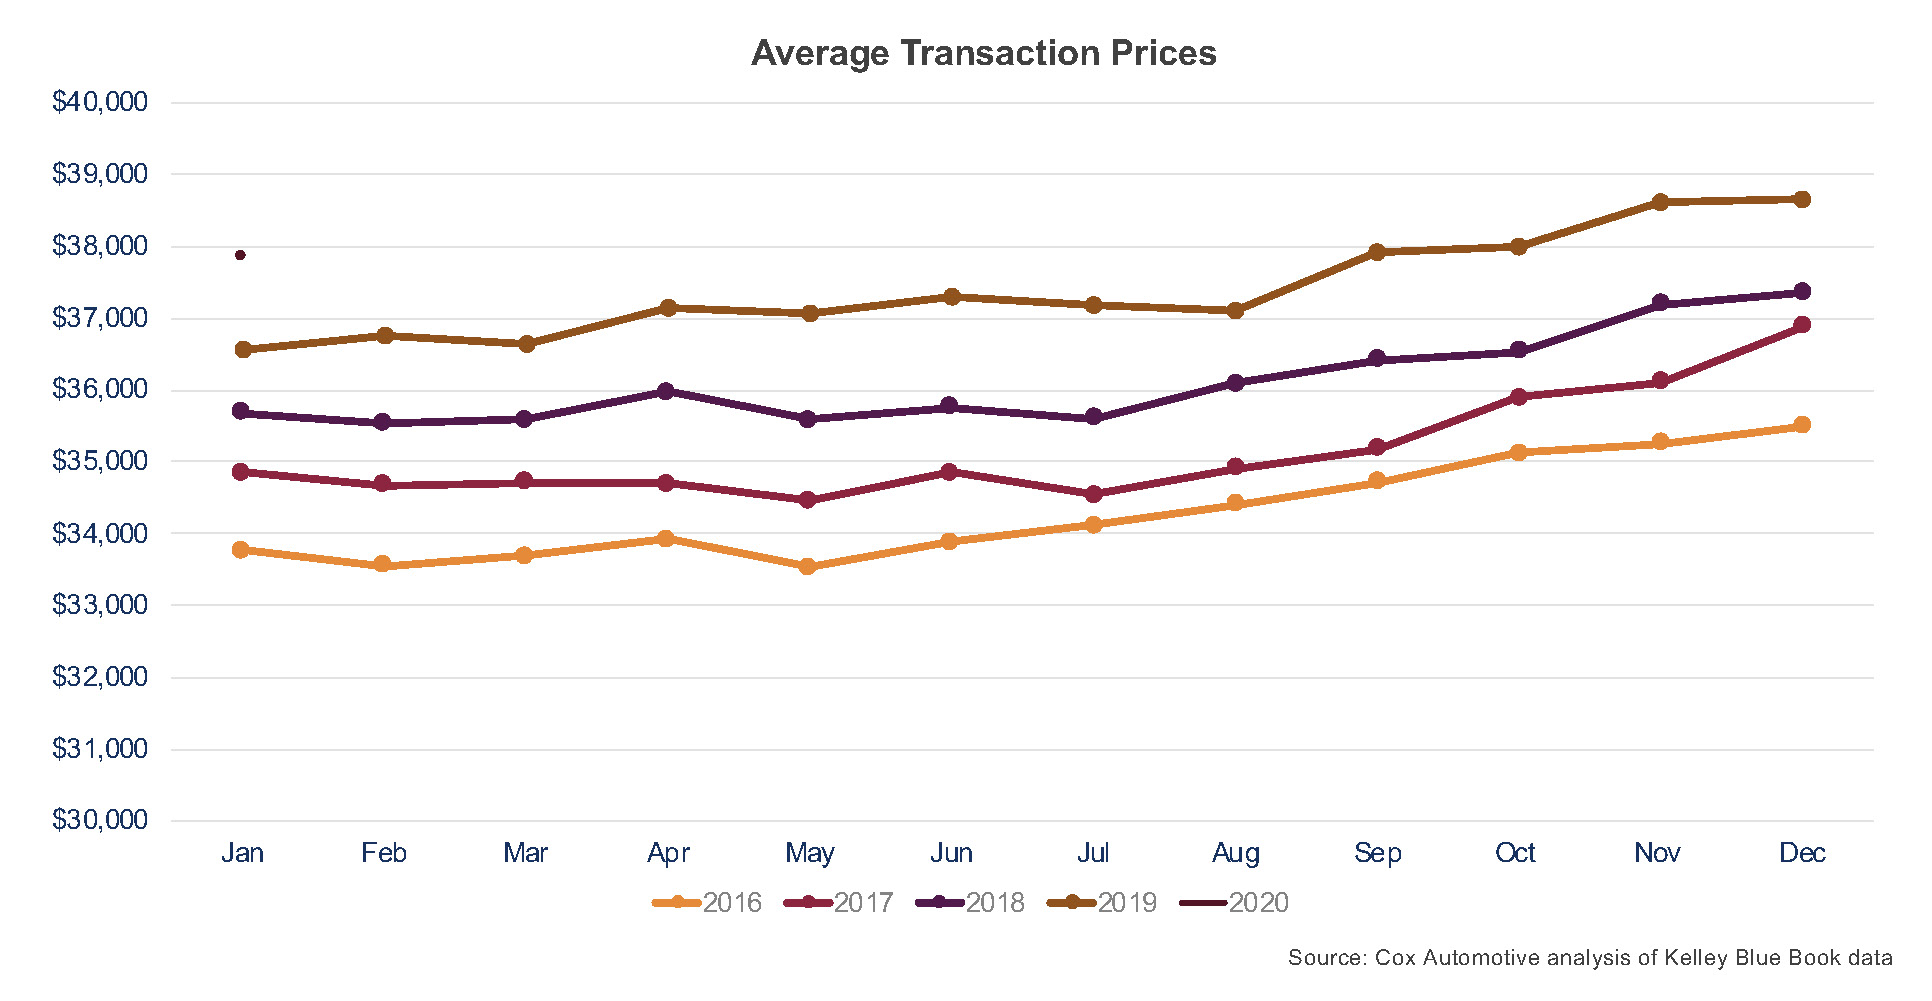
Hyundai and Kia saw the biggest transaction price gains in January with their average prices climbing more than 12%. Again, the sales mix helped. SUV share for the two brands grew by about 10 percentage points, with Hyundai sales at 60% SUV and Kia at 43%. The new Hyundai Palisade and the Kia Telluride continue to lead the charge for both brands – both transacted over $40,000 in January. [See table below.]
Ford Motor Company was another manufacturer with big transaction price increases in January, with both Ford and Lincoln climbing about 6%. Ford’s discontinuation of cars, and specifically the Fiesta and Focus, means less volume on the lower end of the price spectrum. In January, the redesigned Explorer saw the biggest ATP jump for Ford at 12%, while the all-new Escape’s average price rose 6%. Making up nearly a quarter of Lincoln brand sales last month, the new Aviator transacted at $67,730. The new Lincoln Corsair is also enjoying a solid launch and saw a 10% gain in ATPs versus the outgoing MKC.
On a segment level, the market saw one of the biggest jumps in the mid-size pickup truck segment. However, this was largely due to one model, the Jeep Gladiator, which launched in 2019 and whose ATPs are more than $10,000 higher than the next highest mid-size truck. Overall, the average car price fell by 1% from last January, while the average SUV price rose 3%. [See table below.]
Average Transaction Prices by Make
| Jan-20 | Dec-19 | Jan-19 | MOM | YOY | |
| Acura | $39,993 | $40,764 | $41,441 | -1.9% | -3.5% |
| Alfa Romeo | $44,932 | $46,259 | $48,205 | -2.9% | -6.8% |
| Audi | $55,878 | $53,050 | $58,045 | 5.3% | -3.7% |
| BMW | $59,733 | $58,633 | $59,507 | 1.9% | 0.4% |
| Buick | $33,891 | $32,379 | $34,554 | 4.7% | -1.9% |
| Cadillac | $60,337 | $61,575 | $58,925 | -2.0% | 2.4% |
| Chevrolet | $37,801 | $37,660 | $36,666 | 0.4% | 3.1% |
| Chrysler | $38,515 | $37,662 | $38,717 | 2.3% | -0.5% |
| Dodge | $35,356 | $35,046 | $34,243 | 0.9% | 3.2% |
| Fiat | $25,781 | $24,114 | $25,399 | 6.9% | 1.5% |
| Ford | $43,393 | $43,819 | $41,043 | -1.0% | 5.7% |
| Genesis | $48,912 | $47,978 | $50,540 | 1.9% | -3.2% |
| GMC | $47,691 | $49,609 | $46,283 | -3.9% | 3.0% |
| Honda | $27,631 | $27,902 | $27,529 | -1.0% | 0.4% |
| Hyundai | $27,858 | $26,392 | $24,649 | 5.6% | 13.0% |
| Infiniti | $48,775 | $49,659 | $49,766 | -1.8% | -2.0% |
| Jaguar | $63,969 | $60,895 | $58,577 | 5.0% | 9.2% |
| Jeep | $37,715 | $38,201 | $36,358 | -1.3% | 3.7% |
| Kia | $27,540 | $27,800 | $24,495 | -0.9% | 12.4% |
| Land Rover | $78,923 | $77,059 | $77,032 | 2.4% | 2.5% |
| Lexus | $49,180 | $48,752 | $48,793 | 0.9% | 0.8% |
| Lincoln | $57,754 | $58,785 | $54,699 | -1.8% | 5.6% |
| Mazda | $29,780 | $29,862 | $28,066 | -0.3% | 6.1% |
| Mercedes-Benz | $59,802 | $57,532 | $58,350 | 3.9% | 2.5% |
| Mini | $32,751 | $31,639 | $32,798 | 3.5% | -0.1% |
| Mitsubishi | $24,528 | $24,598 | $23,631 | -0.3% | 3.8% |
| Nissan | $29,127 | $29,028 | $27,615 | 0.3% | 5.5% |
| Porsche | $93,572 | $93,240 | $100,404 | 0.4% | -6.8% |
| Ram | $49,664 | $49,862 | $47,358 | -0.4% | 4.9% |
| Subaru | $30,759 | $30,955 | $29,657 | -0.6% | 3.7% |
| Toyota | $31,975 | $32,405 | $30,709 | -1.3% | 4.1% |
| Volkswagen | $28,000 | $29,160 | $27,354 | -4.0% | 2.4% |
| Volvo | $48,187 | $49,138 | $50,155 | -1.9% | -3.9% |
| Industry | $37,851 | $38,657 | $36,555 | -2.1% | 3.5% |
Average Transaction Prices by Segment
| Jan-20 | Dec-19 | Jan-19 | MOM | YOY | |
| Compact Car | $21,312 | $21,139 | $20,487 | 0.8% | 4.0% |
| Compact SUV/Crossover | $29,741 | $29,475 | $29,082 | 0.9% | 2.3% |
| Electric Vehicle | $43,518 | $47,299 | $41,282 | -8.0% | 5.4% |
| Entry-level Luxury Car | $42,981 | $43,435 | $44,432 | -1.0% | -3.3% |
| Full-size Car | $36,437 | $36,040 | $36,491 | 1.1% | -0.1% |
| Full-size Pickup Truck | $49,980 | $50,460 | $49,882 | -1.0% | 0.2% |
| Full-Size SUV/Crossover | $62,743 | $62,790 | $63,449 | -0.1% | -1.1% |
| High Performance Car | $114,411 | $98,300 | $120,914 | 16.4% | -5.4% |
| High-end Luxury Car | $103,430 | $99,435 | $103,414 | 4.0% | 0.0% |
| Hybrid/Alternative Energy Car | $27,934 | $28,249 | $27,905 | -1.1% | 0.1% |
| Luxury Car | $62,933 | $61,647 | $64,903 | 2.1% | -3.0% |
| Luxury Compact SUV/Crossover | $46,858 | $46,312 | $46,663 | 1.2% | 0.4% |
| Luxury Full-size SUV/Crossover | $88,435 | $87,263 | $87,859 | 1.3% | 0.7% |
| Luxury Mid-size SUV/Crossover | $60,260 | $60,066 | $59,838 | 0.3% | 0.7% |
| Luxury Subcompact SUV/Crossover | $39,172 | $38,991 | $39,420 | 0.5% | -0.6% |
| Mid-size Car | $26,395 | $26,300 | $26,124 | 0.4% | 1.0% |
| Mid-size Pickup Truck | $35,688 | $35,662 | $33,791 | 0.1% | 5.6% |
| Mid-size SUV/Crossover | $39,611 | $39,554 | $38,421 | 0.1% | 3.1% |
| Minivan | $35,691 | $35,866 | $35,462 | -0.5% | 0.6% |
| Sports Car | $38,868 | $38,268 | $37,368 | 1.6% | 4.0% |
| Subcompact Car | $17,738 | $17,579 | $17,475 | 0.9% | 1.5% |
| Subcompact SUV/Crossover | $24,592 | $24,597 | $24,451 | 0.0% | 0.6% |
| Van | $37,155 | $36,167 | $34,254 | 2.7% | 8.5% |
| Industry | $37,851 | $38,657 | $36,555 | -2.1% | 3.5% |


