
Ford is forecasted to post improved revenue and earnings when it reports second-quarter financial results after the stock market closes on Thursday, July 27.
Wall Street analysts will be more concerned about future quarters than the most recent one after Ford recently slashed the price of its electric F-150 Lightning and lowered the Mustang Mach-E price on mounting inventory outpacing demand. Ford’s pricing moves, which caused its stock price to drop, come ahead of new EV truck introductions from competitors Tesla and Chevrolet.
In the quarter, Ford Motor’s sales, mostly dragged down by slumping Lincoln brand sales, rose but underperformed the overall market. Sales volume has not returned to pre-pandemic levels. Ford bumped up incentive spending in Q2, but it remains below pre-pandemic, pre-chip shortage levels. Meantime, average transaction prices soared even higher, reaching new heights.
Here are some data points from Cox Automotive on Ford Motor’s Q2 market performance in the U.S., Ford’s most important market.
Ford’s Q2 Sales Improve But Still Are Off Pre-Pandemic Highs
Ford sold 527,905 Ford and Lincoln brand vehicles in the second quarter, up 10% from the year-ago quarter, according to Cox Automotive calculations. It was Ford’s highest sales volume for a second quarter since 2019 but still far off its pre-pandemic highs of well over 600,000 units in the second quarter of 2018 and 2019.
Ford Motor Company U.S. Sales Performance for Q2 2023
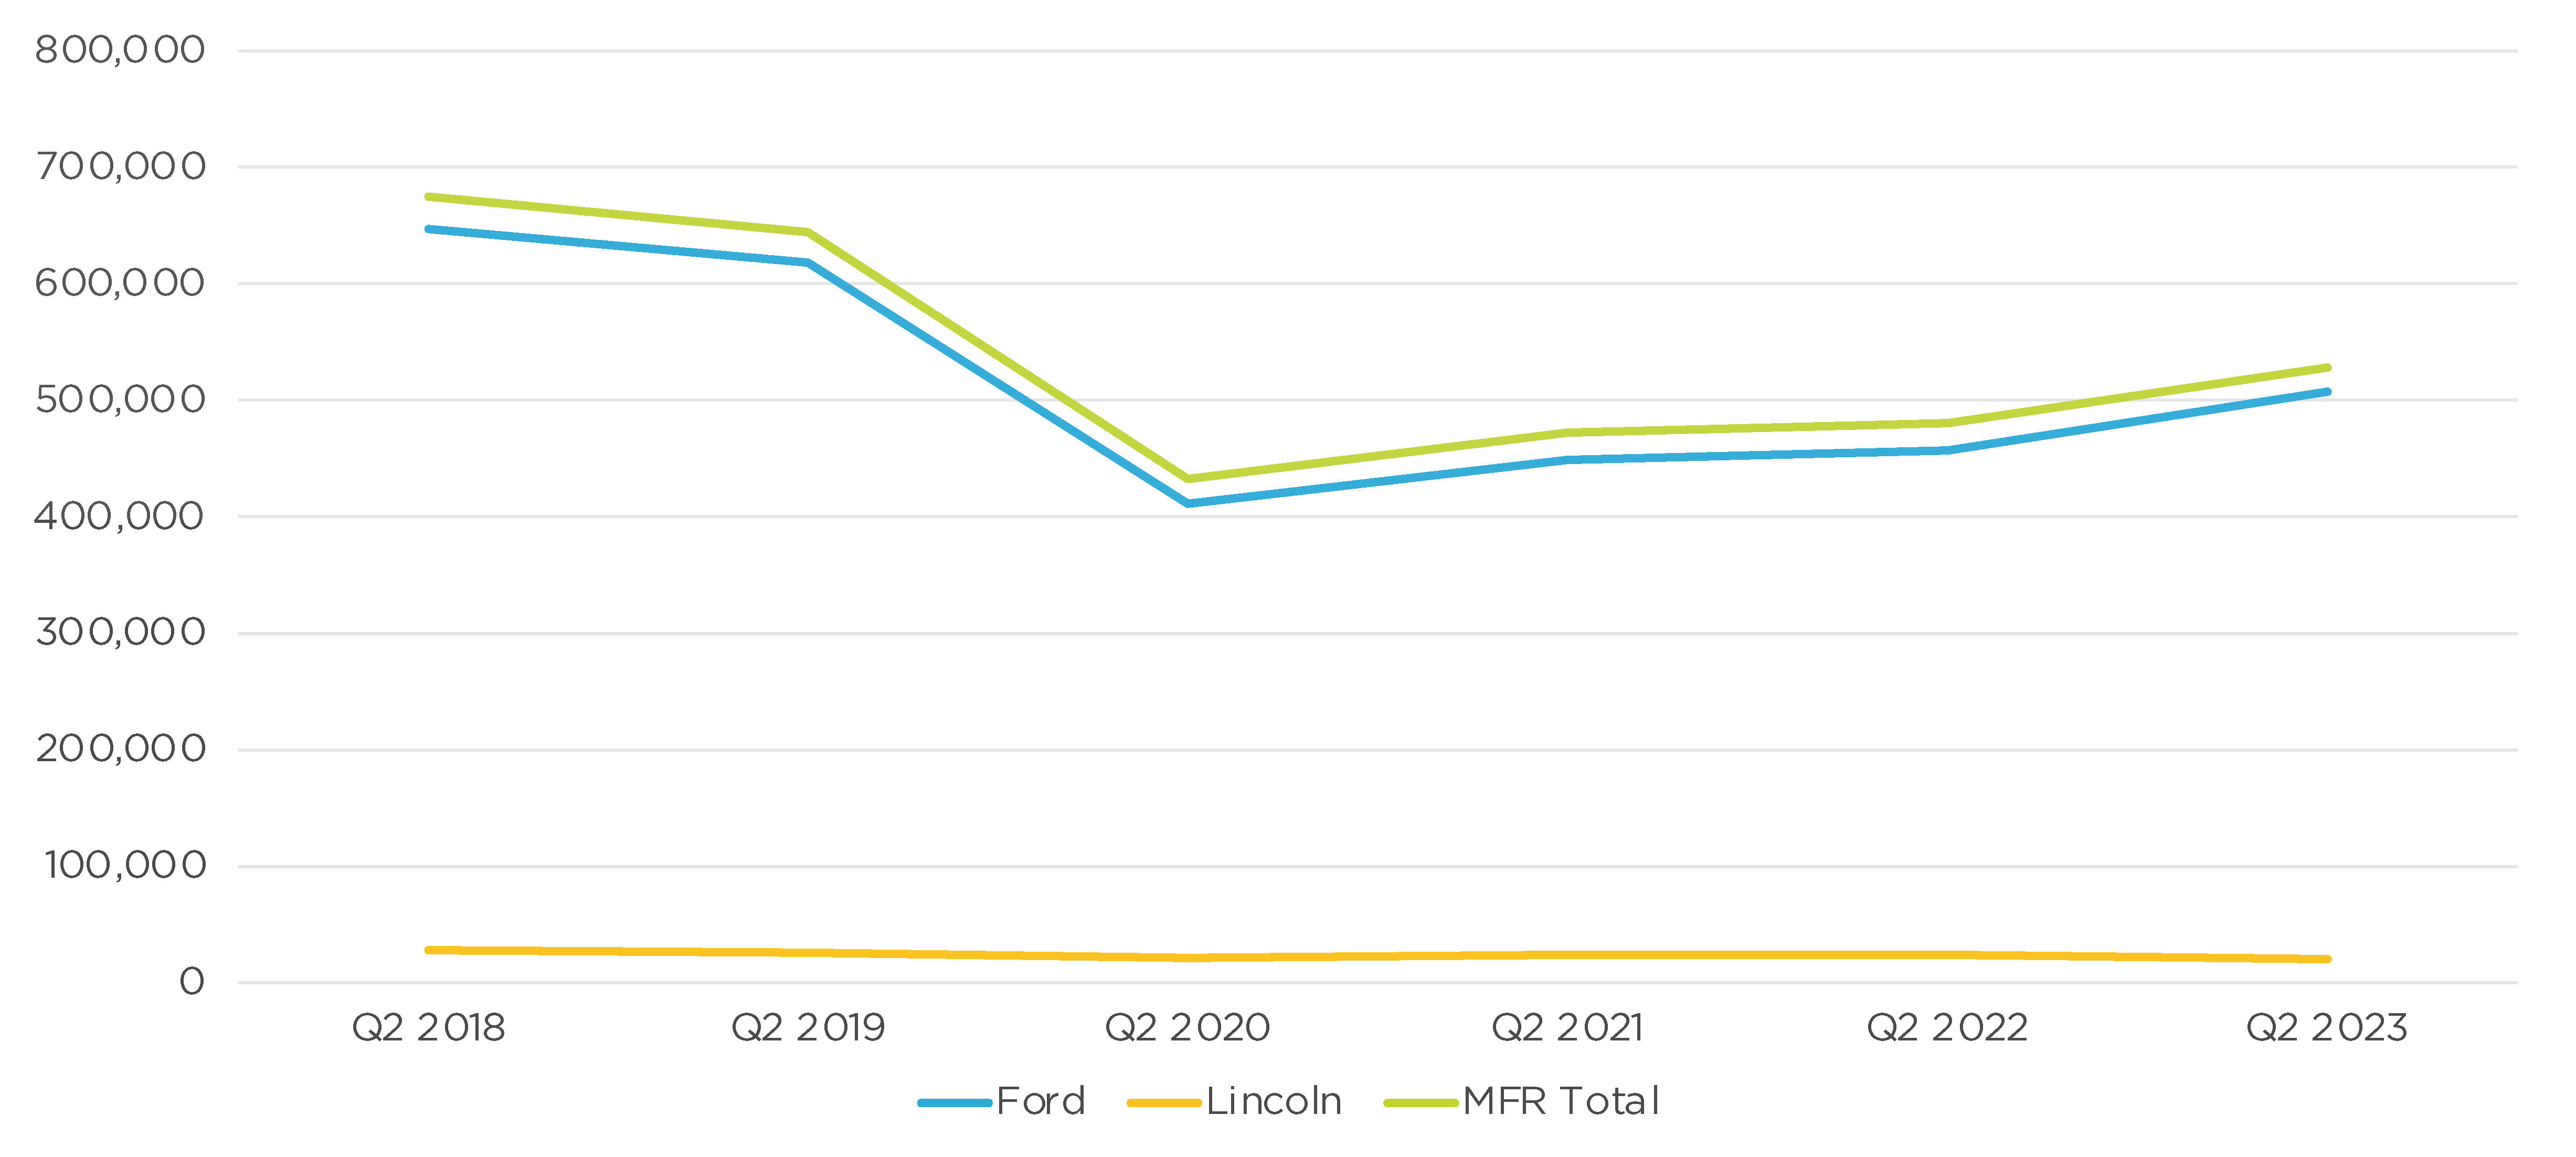
Ford brand sales rose 11% to 507,781 vehicles, its highest sales volume for a second quarter since 2019, when the brand was 618,558 vehicles. Model by model, Ford’s results were mixed, with some up double digits and others down as much.
Sales gainers included the all-important F-Series, which posted a 34% sales hike to 212,516 units. Bronco Sport, Transit, Edge, Escape, Expedition and Maverick were on the plus side. The Bronco, Explorer and Mustang (a fresh model is on the way) were down double digits. The electric Mustang Mach-E had a 21% drop in sales to 8,633 units.
Lincoln sold only 20,124 vehicles, down 15% in an overall market that was up and the brand’s lowest sales volume in at least six years. For comparison, in Q2 2018, Lincoln sold nearly 28,000 vehicles.
The Navigator was Lincoln’s bright spot. Sales of Lincoln’s money maker were up 20% to 4,688 units, the model’s highest second-quarter sales since 2018. The Nautilus was up a scant 1% to 6,851 units. But the gains were not enough to offset losses. Sales of the Aviator were halved to under 3,000 units. Corsair sales fell 21% to 5,608 units.
Ford Market Share Slips
Ford underperformed the overall market, which had sales up 17% for the quarter, causing its market share to slip. Ford’s total market share was 12.8%, according to Cox Automotive calculations. Ford’s share was only lower once – in the second quarter of 2021 when it was 10.7%. The 2021 and 2023 second quarters marked the only time in the past six years that Ford’s share was below 13% for the quarter.
Ford brand’s share slipped .63 percentage points to 12.34%, its lowest second only to the second quarter of 2021 when it was 10.15%. Before 2021, Ford’s share was routinely near 14%.
Lincoln’s share dropped to .49%, down .19 percentage points. It was Lincoln’s lowest market share in at least the past six years for the quarter.
Ford Boosted Incentive Spending to $2,058 per Vehicle on Average
Ford ramped up incentives substantially over 2022’s second quarter, but incentives still were historically low. Ford boosted incentive spending by 71% overall to an average of $2,058 per vehicle. While higher than a year ago, Ford’s average vehicle spend is about half of what it was in the second quarter of 2018 to 2020.
FORD MOTOR COMPANY U.S. INCENTIVE SPENDING FOR Q2 2023
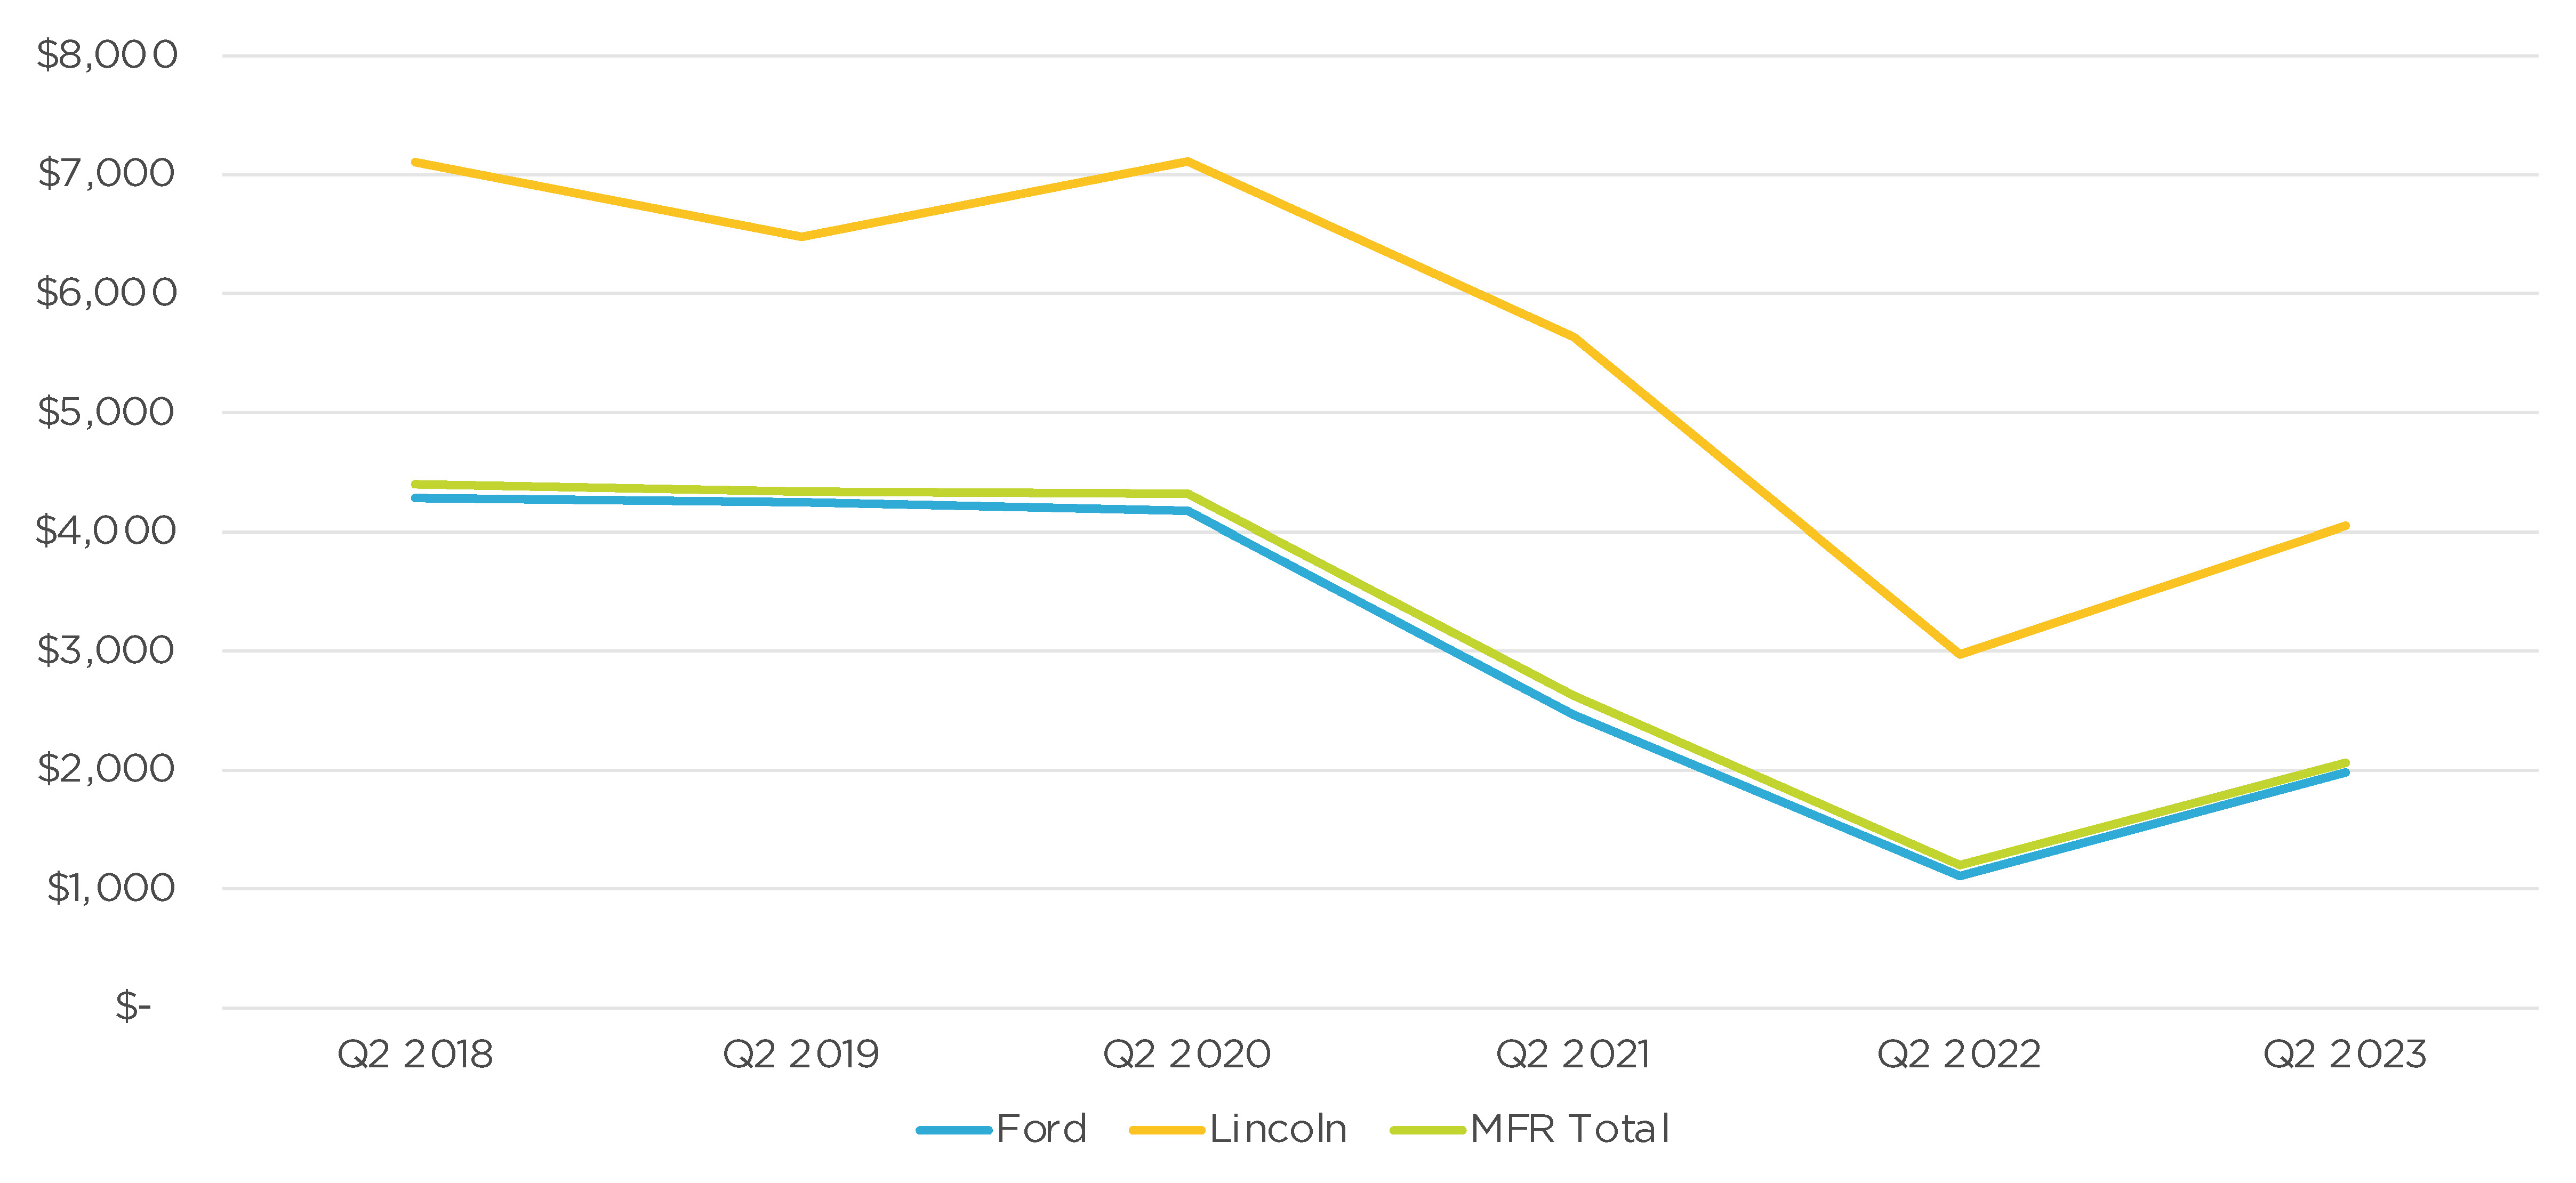
The Ford brand got the biggest bump, up 78% to an average of $1,979, still the second lowest in the past six years. Before the pandemic, Ford brand spent more than $4,000 per vehicle on average.
Lincoln incentives increased by 36% to $4,051 per vehicle. Before 2021, Lincoln incentives ranged from $5,600 to more than $7,000 per vehicle on average.
Ford’s ATP Rose to New Heights
Ford’s average transaction price (ATP) rose 8% to $56,270, its highest level for the quarter, according to Cox Automotive calculations. Similarly, both the Ford and Lincoln brands hit their highest ATPs for the quarter.
FORD MOTOR COMPANY U.S. AVERAGE TRANSACTION PRICE FOR Q2 2023
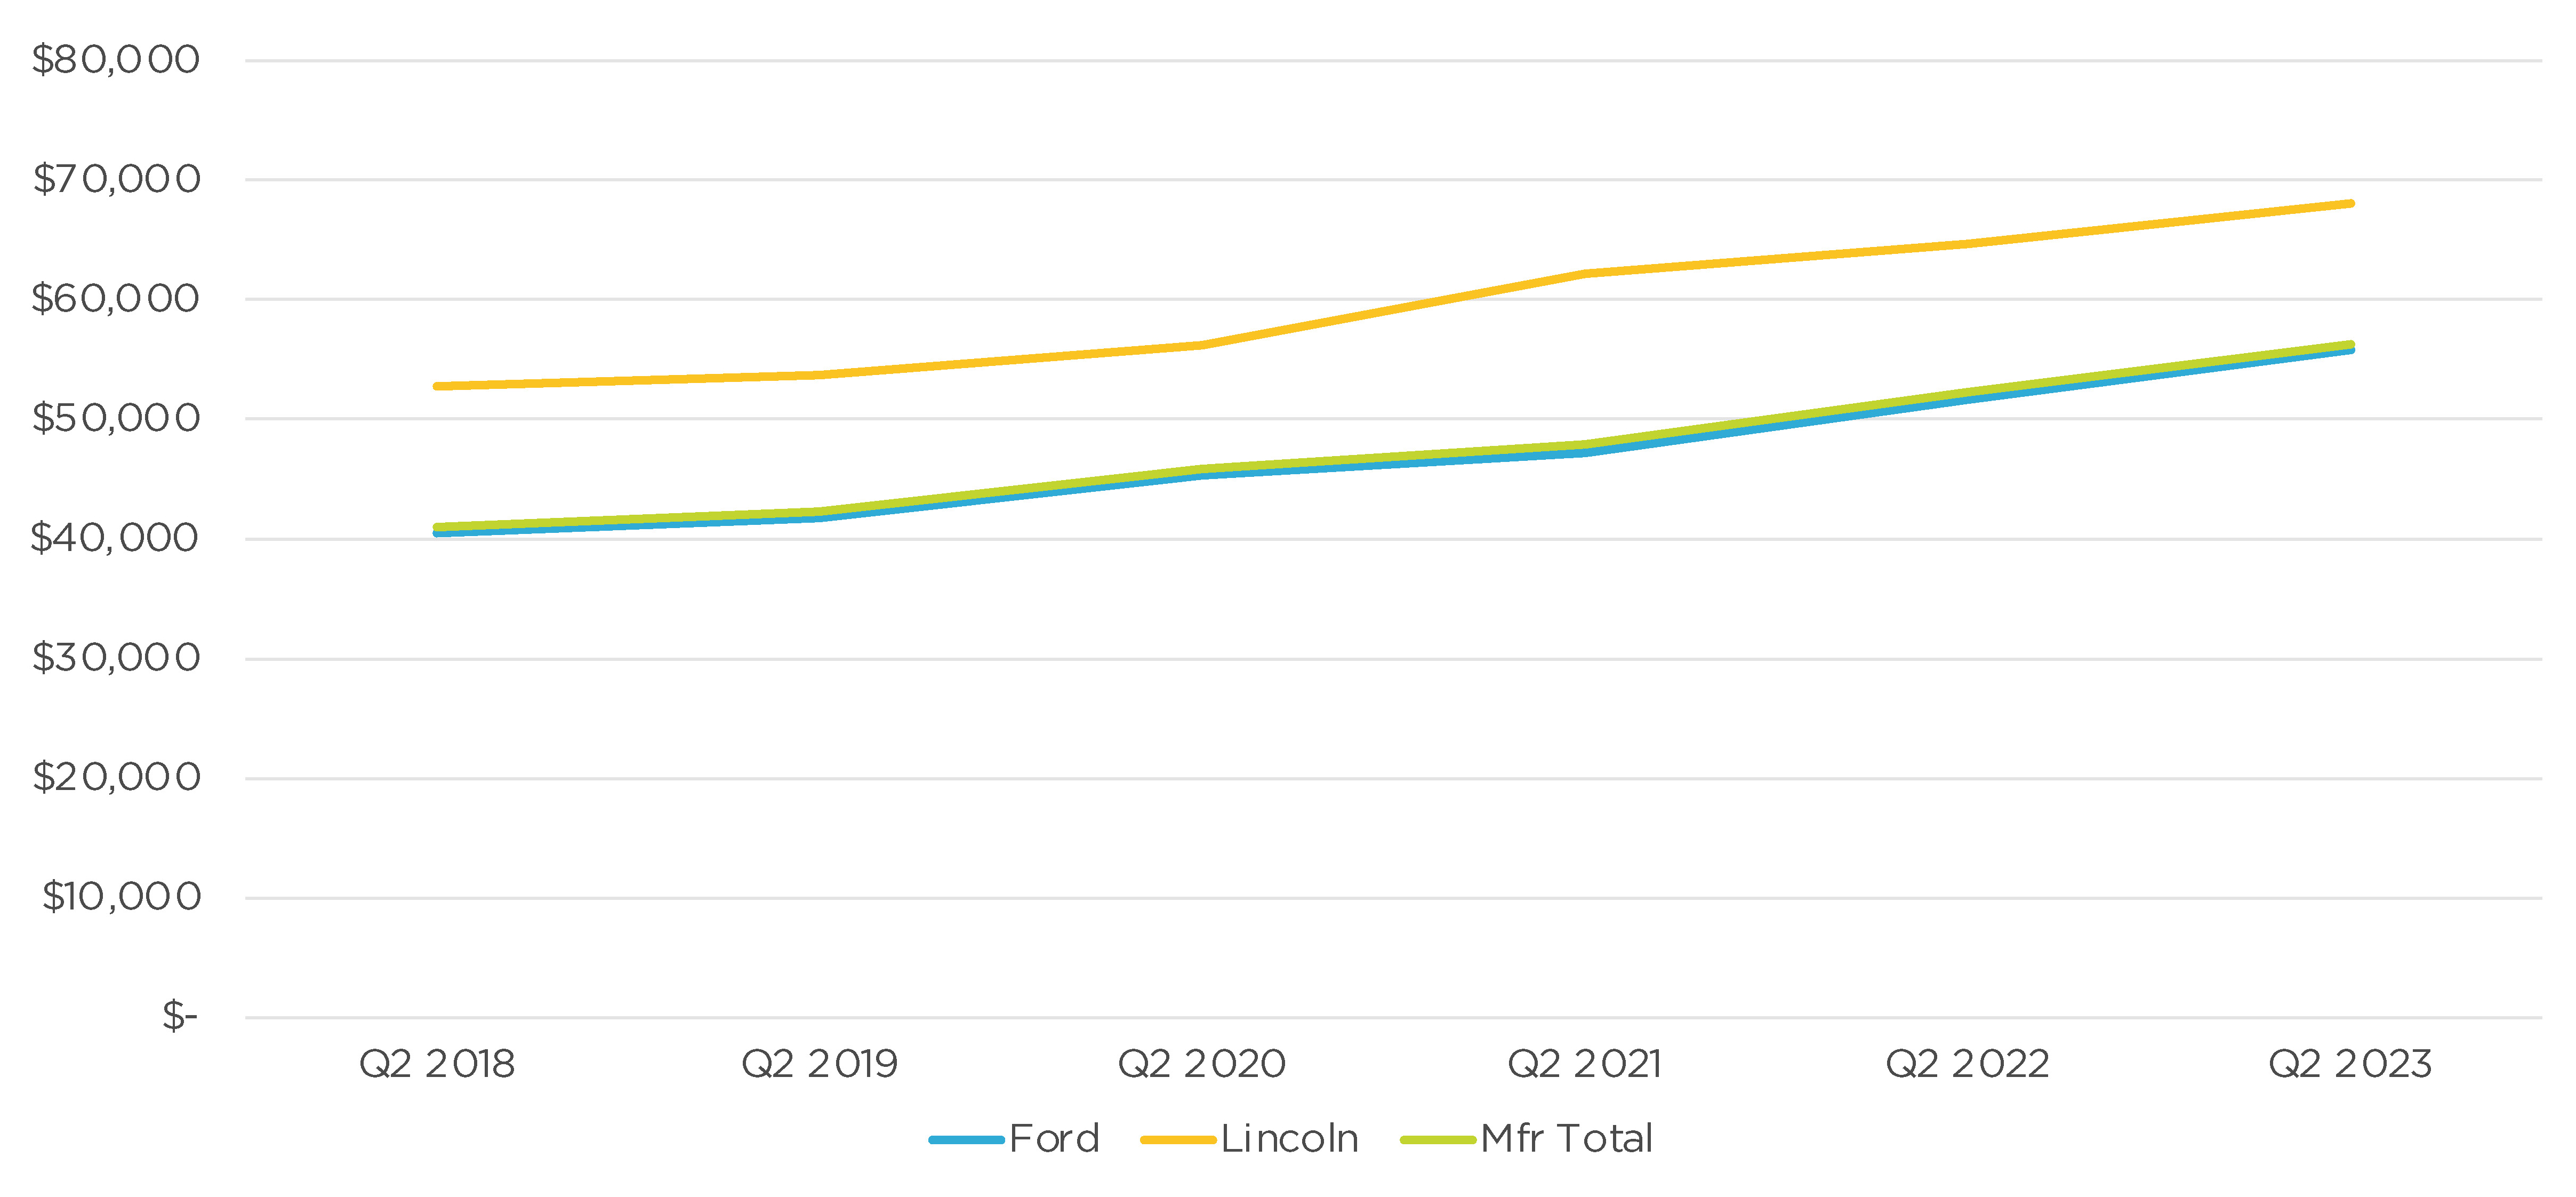
Ford brand had the biggest hike, with its ATP up 8% to $55,803. As with sales, model-by-model ATPs varied widely, with some up significantly and others down.
In high demand, the Bronco saw a 13% hike in its ATP to $58,131. The ATP for the Transit van rose 13% to $58,826, thanks to the addition of a pricier electric model and strong demand and pricing power for commercial vehicles. The E-Series commercial van also saw a big boost in ATP and sales.
The ATP for most other models rose by single digits. The F-Series had a 4% gain to $66,013. The Maverick, which comes standard as a hybrid, saw its ATP rise 6% to over $30,000. Previously, it was Ford’s only model with an ATP below $30,000, excluding the EcoSport, which was discontinued and sales are winding down. Now Ford has none in that category, though the Maverick remains Ford’s least expensive vehicle.
The electric Mustang Mach-E had its ATP drop by 3% to $57,809 as Ford cut prices to compete with Tesla’s price reductions.
Lincoln’s ATP rose 5% to $68,053, pulled up by the brand’s priciest model, the Navigator. The SUV’s ATP increased the most of any model, up 4% to $105,976. The Nautilus’ ATP climbed 3% to $57,695. The Corsair edged 1% higher to $47,770. The Aviator, the brand’s second most expensive model, was off 1% but stayed above $70,000.

