Data Point
Cox Automotive Analysis: Ford Motor Company’s Q3 2023 U.S. Market Performance
Wednesday October 25, 2023
Article Highlights
- Ford Q3 sales underperformed, up 8% year-over-year for a 12.8% market share.
- Ford Motor boosted incentives by 194% to an average of $2,731 per vehicle.
- Ford’s overall ATP edged 4% higher to $56,339, but price growth is slowing.
Editor’s note: On the evening of Wednesday, Oct. 25, after this post was published, Ford and the UAW reached a tentative agreement on a new four-year contract. The contract has not been ratified by the UAW membership, but striking Ford workers will be going back to work, ending the production stoppages in Michigan, Kentucky and Illinois.
The impact of the UAW strike against the Detroit automakers will be the focus of Ford’s third-quarter financial results when they are posted after the stock market closes on Thursday, Oct. 26.
But Wall Street analysts will be looking ahead, beyond the third current quarter and into the fourth quarter, when the damage from the strike hits hardest. The strike started on Sept. 15, only a couple weeks before the third quarter closed. Analysts estimate Ford is currently losing $44 million a day, though Ford has not confirmed a number.
The UAW strike began with stoppages at three U.S. assembly plants, one for each major automaker. The first Ford strike target was the Michigan plant that builds the popular Ford Bronco SUV and Ranger pickup. The union then opted to strike Ford’s Chicago plant that produces the Ford Explorer, Lincoln Aviator and Ford police vehicles. Most recently, the UAW expanded its strike to include the all-important truck assembly complex in Louisville, Ky., where Ford builds the high-profit-margin Ford Super Duty pickup trucks alongside the cash-generating Ford Expedition and Lincoln Navigator large SUVs.
In the third quarter, Ford sales gained 8%, which was still less than the overall market, up 16%. Ford’s underperformance in the quarter came despite the vastly increased incentive spending from a year ago. Ford’s average transaction price edged slightly higher from a year ago but was down from the second quarter, indicating prices are stabilizing.
Here are some data points from Cox Automotive on Ford Motor Company’s Q3 market performance in the U.S., the automaker’s most important market.
Ford’s Q3 Sales Improve But Not to Pre-Pandemic Levels
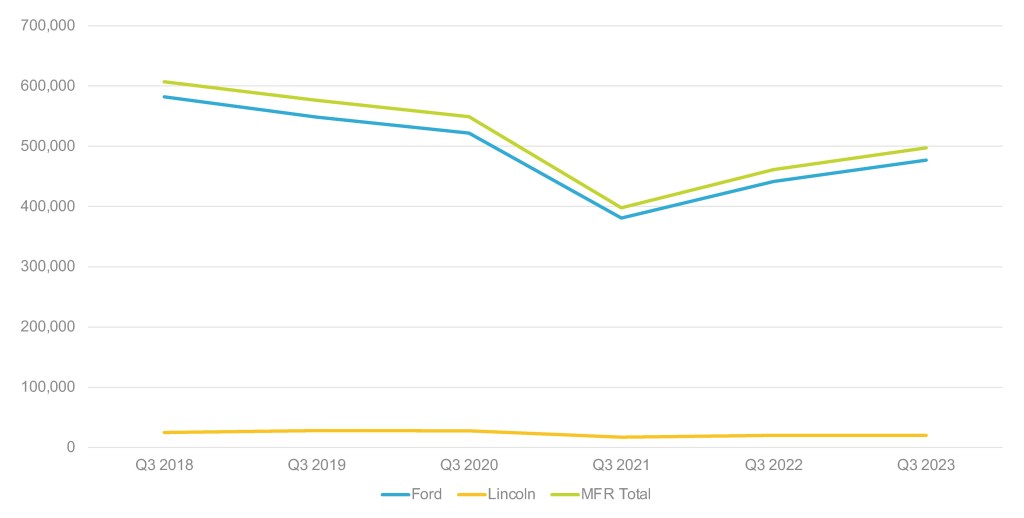
Ford sold 497,108 Ford and Lincoln brand vehicles in the third quarter, up 8% from the year-ago quarter, according to Cox Automotive calculations. It was Ford’s highest sales volume for the third quarter since 2020 but remained off pre-pandemic highs. Ford underperformed the overall market, up 16% in the quarter.
Ford Motor Company U.S. Sales Performance for Q3 2023

Ford brand sales rose 8% to 476,725 vehicles, its highest sales volume for a third quarter since 2020. Results were widely mixed by model, with some up hefty double digits and others down that amount.
The Bronco SUV and Ranger pickup had sales down 16% and 41%, respectively, due in part to supply shortages caused by the strike at the plant. October opened with a scant 33 days’ supply for the Ranger and 45 days’ supply for the Bronco, according to Cox Automotive’s analysis of its vAuto inventory data. Both models were well below the industry’s average days’ supply of 60.
Sales gainers included the all-important F-Series, which saw sales increase 13% to 190,477 units. With the UAW now striking the Kentucky plant that makes the Super Duty trucks, that could change. Depending on the version, the days’ supply for Super Duty trucks ranged from 51 to 89 days’ supply at the start of October.
The small Maverick pickup truck, always in short supply, had sales soar by a whopping 83% to nearly 24,000 units. The Edge and Bronco Sport were up 55% and 50%, respectively. The Transit commercial van was up 28%, the electric Mustang Mach-E rose 43% to nearly 15,000 units, and Escape sales gained 10%.
The Explorer, which earlier had a stop-sale order on it and now some earlier Explorer models are under recall, was down 37% in the quarter. The Explorer had a hefty inventory of 119 days’ supply at the start of October after the Chicago plant that makes it went on strike on Sept. 29.
Lincoln reversed its downward trend but barely. Sales edged up only 2% to 20,383. Like the Explorer, the Aviator has had product issues and is not being produced due to the strike. Its sales were down 75% to less than 1,500 units in the quarter.
All other Lincoln models had double-digit sales increases. The pricey flagship Navigator was up 46% to 4,527 units. Its days’ supply was around 70 at the start of October after the plant went on strike. Sales of the volume-leading Corsair rose 26% to 7,852 units. Nautilus sales climbed 32% to 6,541 units.
Ford’s Market Share Drops From a Year Ago to 12.8%
With its sales underperforming the overall market, Ford’s total market share slipped to 12.8%, according to Cox Automotive calculations. That was about even with the second quarter but down from 13.6% a year ago.
Ford brand’s share caused the bulk of the drop. The brand’s share fell a percentage point to 11.99% from 12.91% in the year-ago third quarter. Lincoln’s share was roughly on par with a year ago at .51%.
Ford Boosts Incentive Spending to $2,731 per Vehicle on Average
Ford significantly boosted incentives in the third quarter compared with a year ago. However, incentives in 2022 were extremely low due to tight supply caused by the computer chip shortage. Ford’s overall incentives remain historically low.
FORD MOTOR COMPANY U.S. INCENTIVE SPENDING FOR Q3 2023

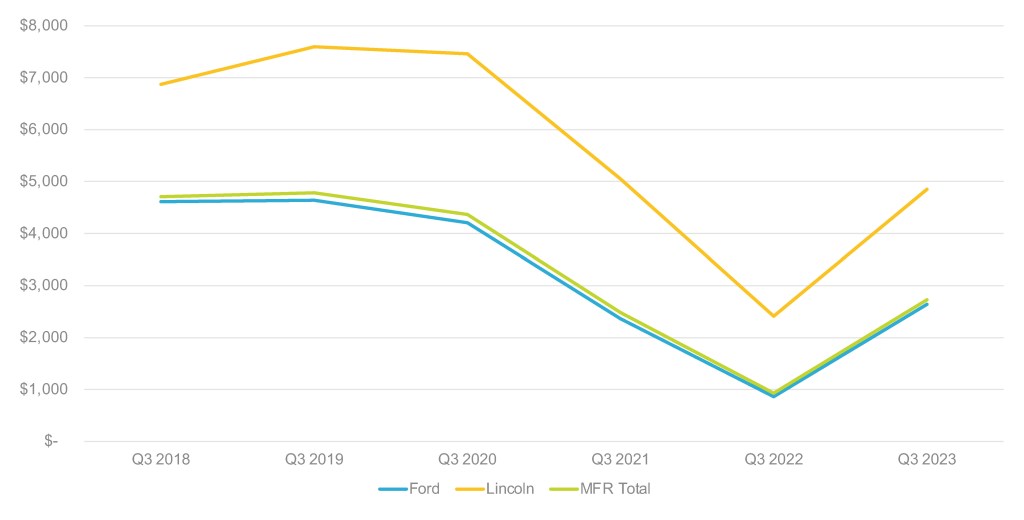
Ford boosted incentive spending by 194% overall to an average of $2,731 per vehicle, according to Cox Automotive calculations, up from $930 a year ago and up from $2,058 in the second quarter. While rising, Ford’s incentives remain well off the highs of 2018 to 2020 when they were over $4,000 per vehicle and even close to $5,000 per vehicle at times.
The Ford brand got the biggest hike, up 206% to an average of $2,641 per vehicle. That was up from $863 a year ago, up from $2,366 in the third quarter of 2021 and up from $1,979 in this year’s second quarter. Before the pandemic, Ford brand spent more than $4,000 per vehicle on average.
Lincoln incentives increased by 101% to an average of $4,853 per vehicle, up from $2,412 a year ago and $4,051 per vehicle in this year’s second quarter. Between 2018 and 2021, Lincoln incentives ranged from $5,000 to more than $7,500 per vehicle on average.
Ford’s ATP Edged 4% Higher Than a Year Ago But Down From the Second Quarter
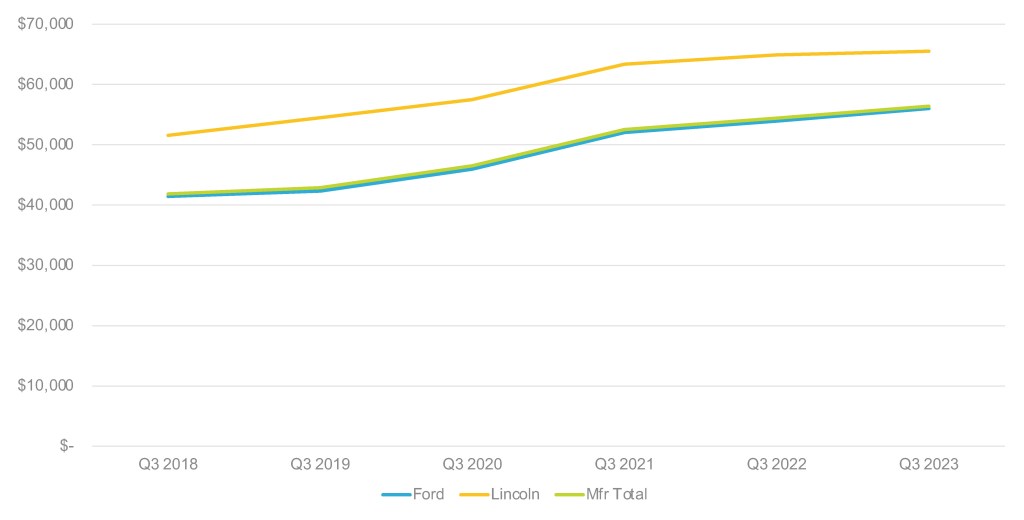
Ford’s average transaction price (ATP) rose 4% in the third quarter compared with a year ago to $56,339, a new quarterly high, according to Cox Automotive calculations. In line with the overall market, prices are not continuing to grow at the pace seen in the past few years and are beginning to retreat.
FORD MOTOR COMPANY U.S. AVERAGE TRANSACTION PRICE FOR Q3 2023

Ford brand’s ATP was up nearly 4% to $56,009 from a year ago but down from $56,270 in this year’s second quarter. Still, it was Ford brand’s highest-ever ATP for the third quarter.
The ATP for the Bronco soared 14% from a year ago to $60,733 and up about $2,000 from the second quarter. On the strength of a robust commercial vehicle market and the addition of an EV version, the Transit van had a 12% hike in its ATP to $58,584, about even with the second quarter.
The rest of Ford’s models were mixed. The F-Series gained 4% to $66,787, a bit ahead of the second quarter. Other models, like the Bronco Sport, Escape and Maverick, also had single-digit gains. The Maverick has the lowest ATP of any Ford model at $30,907.
The ATP for the electric Mustang Mach-E held flat at $58,389 due to intense competition in the EV market and Tesla’s price cutting.
The Explorer’s ATP went in reverse, down 5% to $47,819.
Lincoln’s ATP edged 1% higher to $65,523, its highest for the quarter, but down from the second quarter’s $68,053. The top-of-the-line Navigator had the biggest rise at 4% and the biggest price tag at $105,065. The other Lincolns were flat or up only 1% to 2%.
