
Ford reports third-quarter 2020 financial results Wednesday, Oct. 28, after the stock market closes. Despite the pandemic, analysts expect relatively healthy earnings on the strength of solid sales in North America, where profit-hefty pickup trucks and SUVs are going gangbusters, and Europe, where Ford likely narrowed its losses.
Here are key data points from Cox Automotive on Ford’s third-quarter performance in the U.S. market, where the company derives the bulk of its profits.
Sales and market share
Ford’s Q3 sales, including Ford and Lincoln brand vehicles, dipped by only 5% to 549,084 vehicles, outperforming the industry, which had a 10% sales drop, according to Cox Automotive data. As a result, Ford’s total market share climbed to 14.9% from 14.69% in Q3 2019.
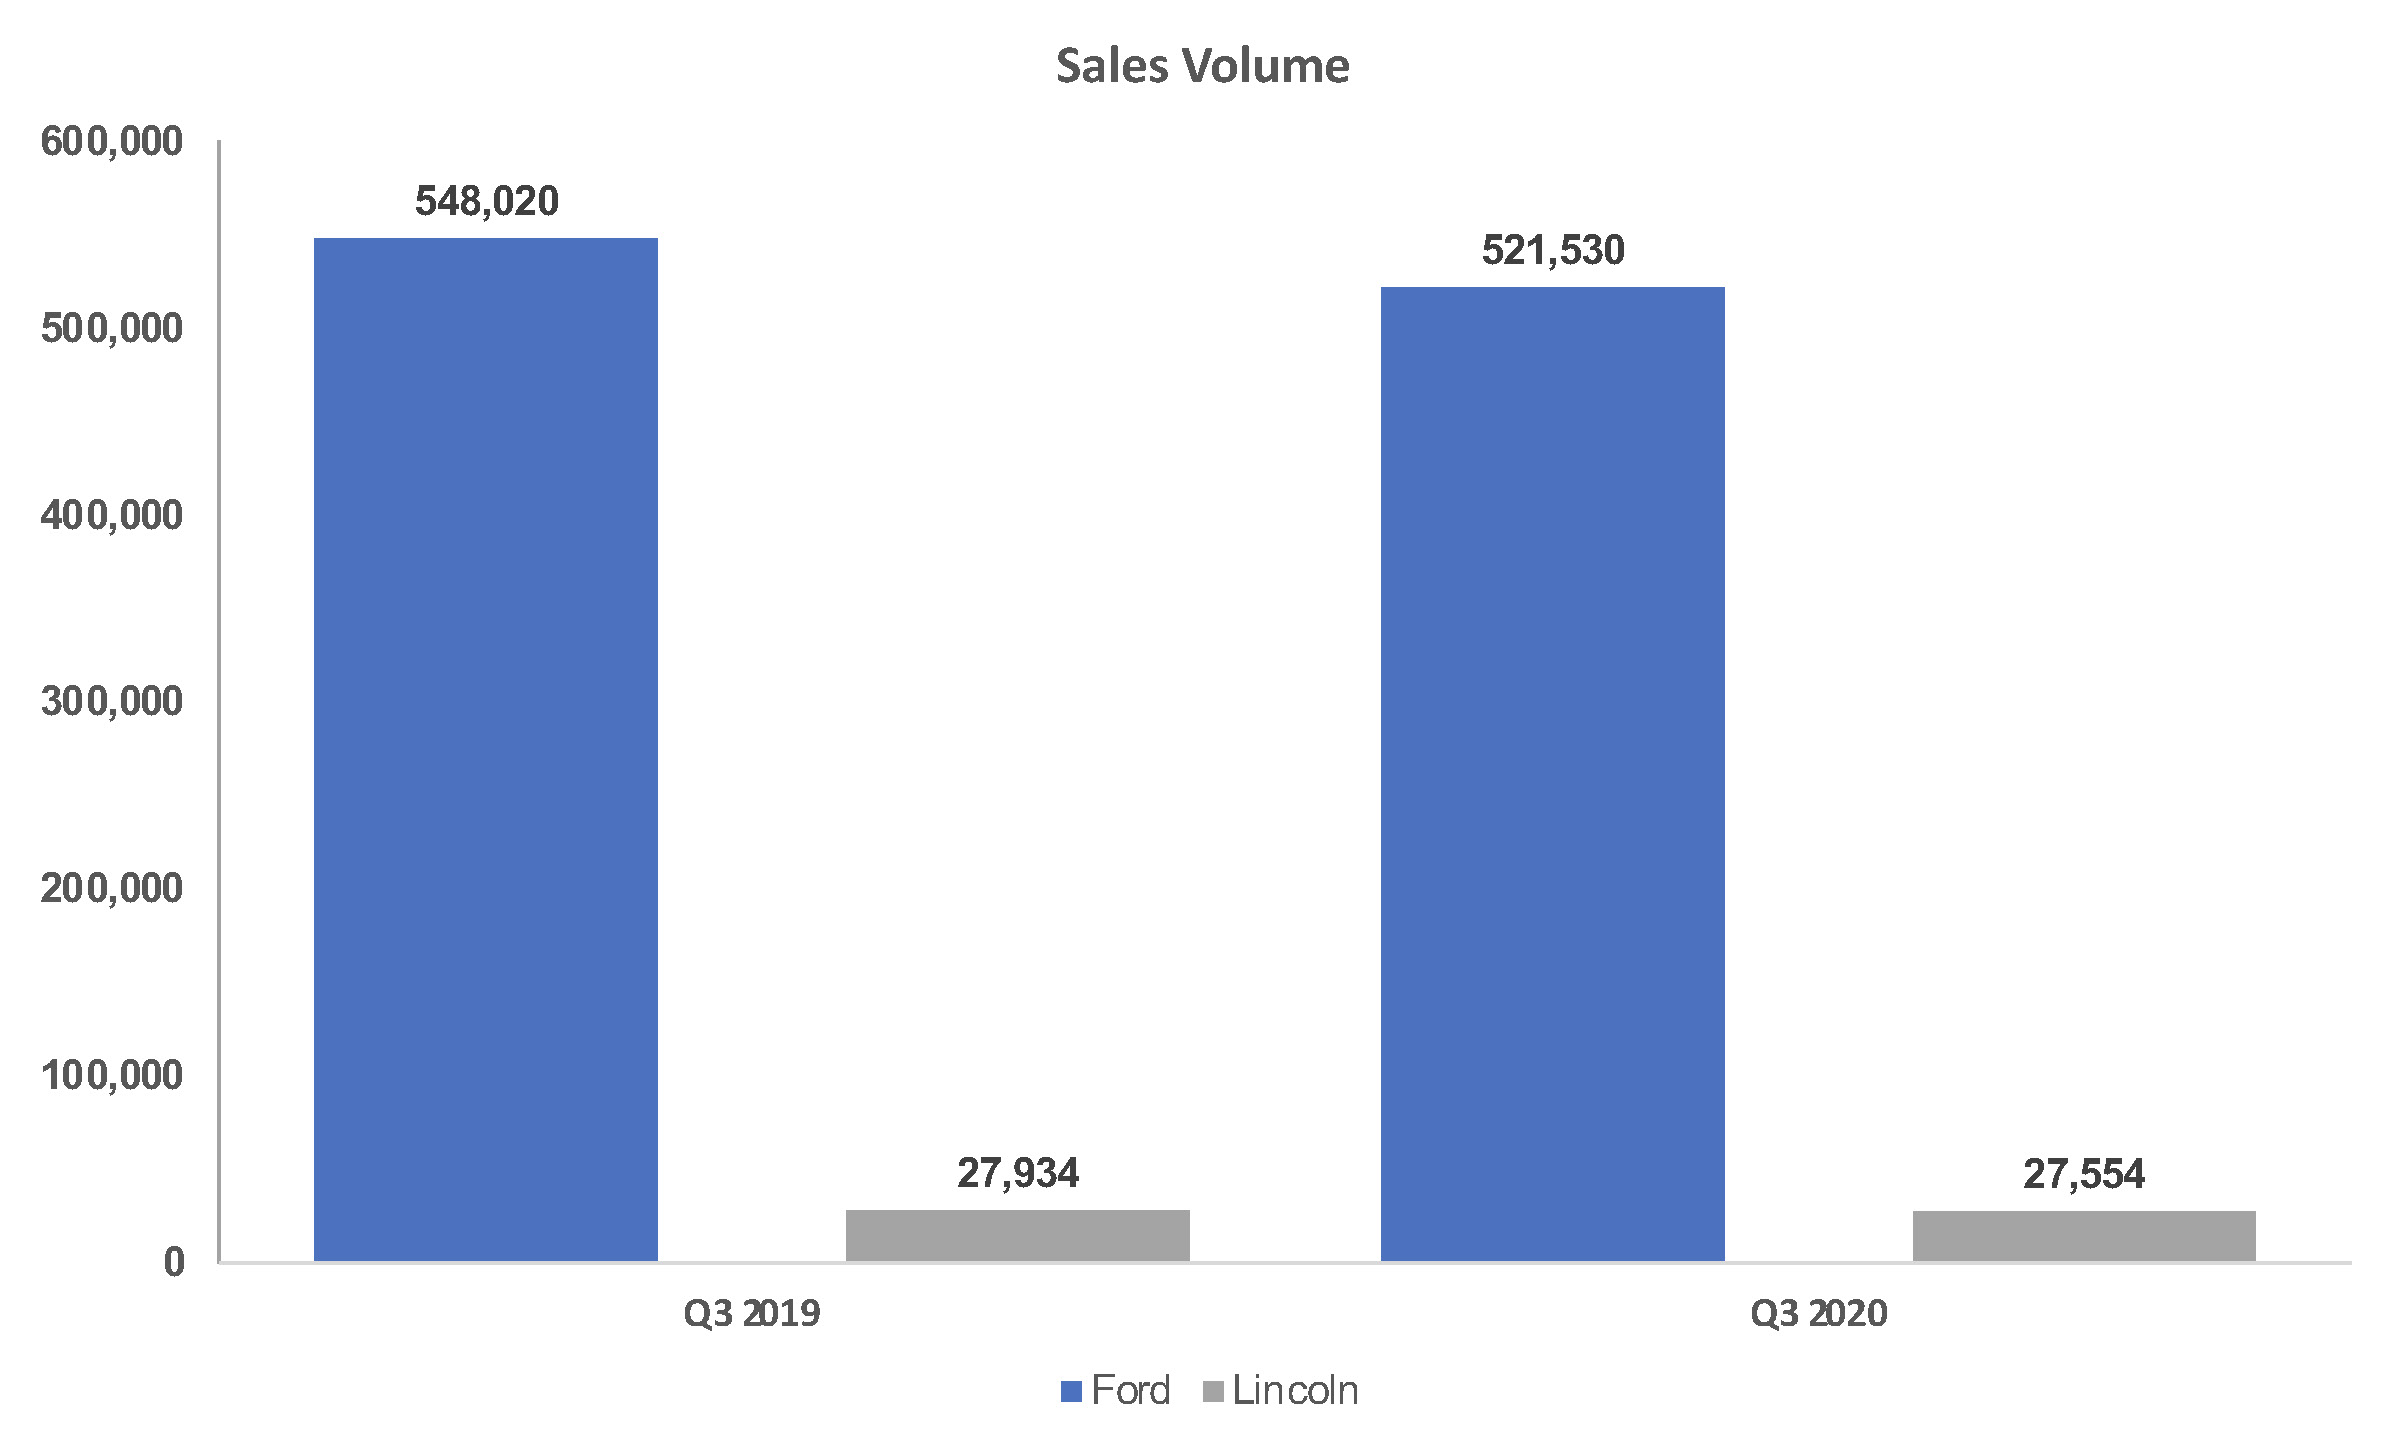
Ford brand sales dropped 5% to 521,530 vehicles. The Ford Explorer drove volume, with sales up 74% to nearly 60,000 units. The robust SUV market didn’t help the Escape and Edge, likely to be discontinued in the future, with sales down double digits. F-Series pickup trucks saw a nearly 4% sales hike to 221,647 vehicles. Ranger pickup sales were also up 8%, and the Expedition had a 4% increase.
Lincoln sales fell a scant 1% to 27,554 vehicles, its second-best Q3 in five years. The new Aviator kicked in 6,118 sales, up from less than 2,000 a year ago. The Corsair had an 8% increase. The rest of the models, some of which are being discontinued, declined.
Incentives
Ford cut overall incentives by 8% to a still hefty $4,410 per vehicle, according to Kelley Blue Book.
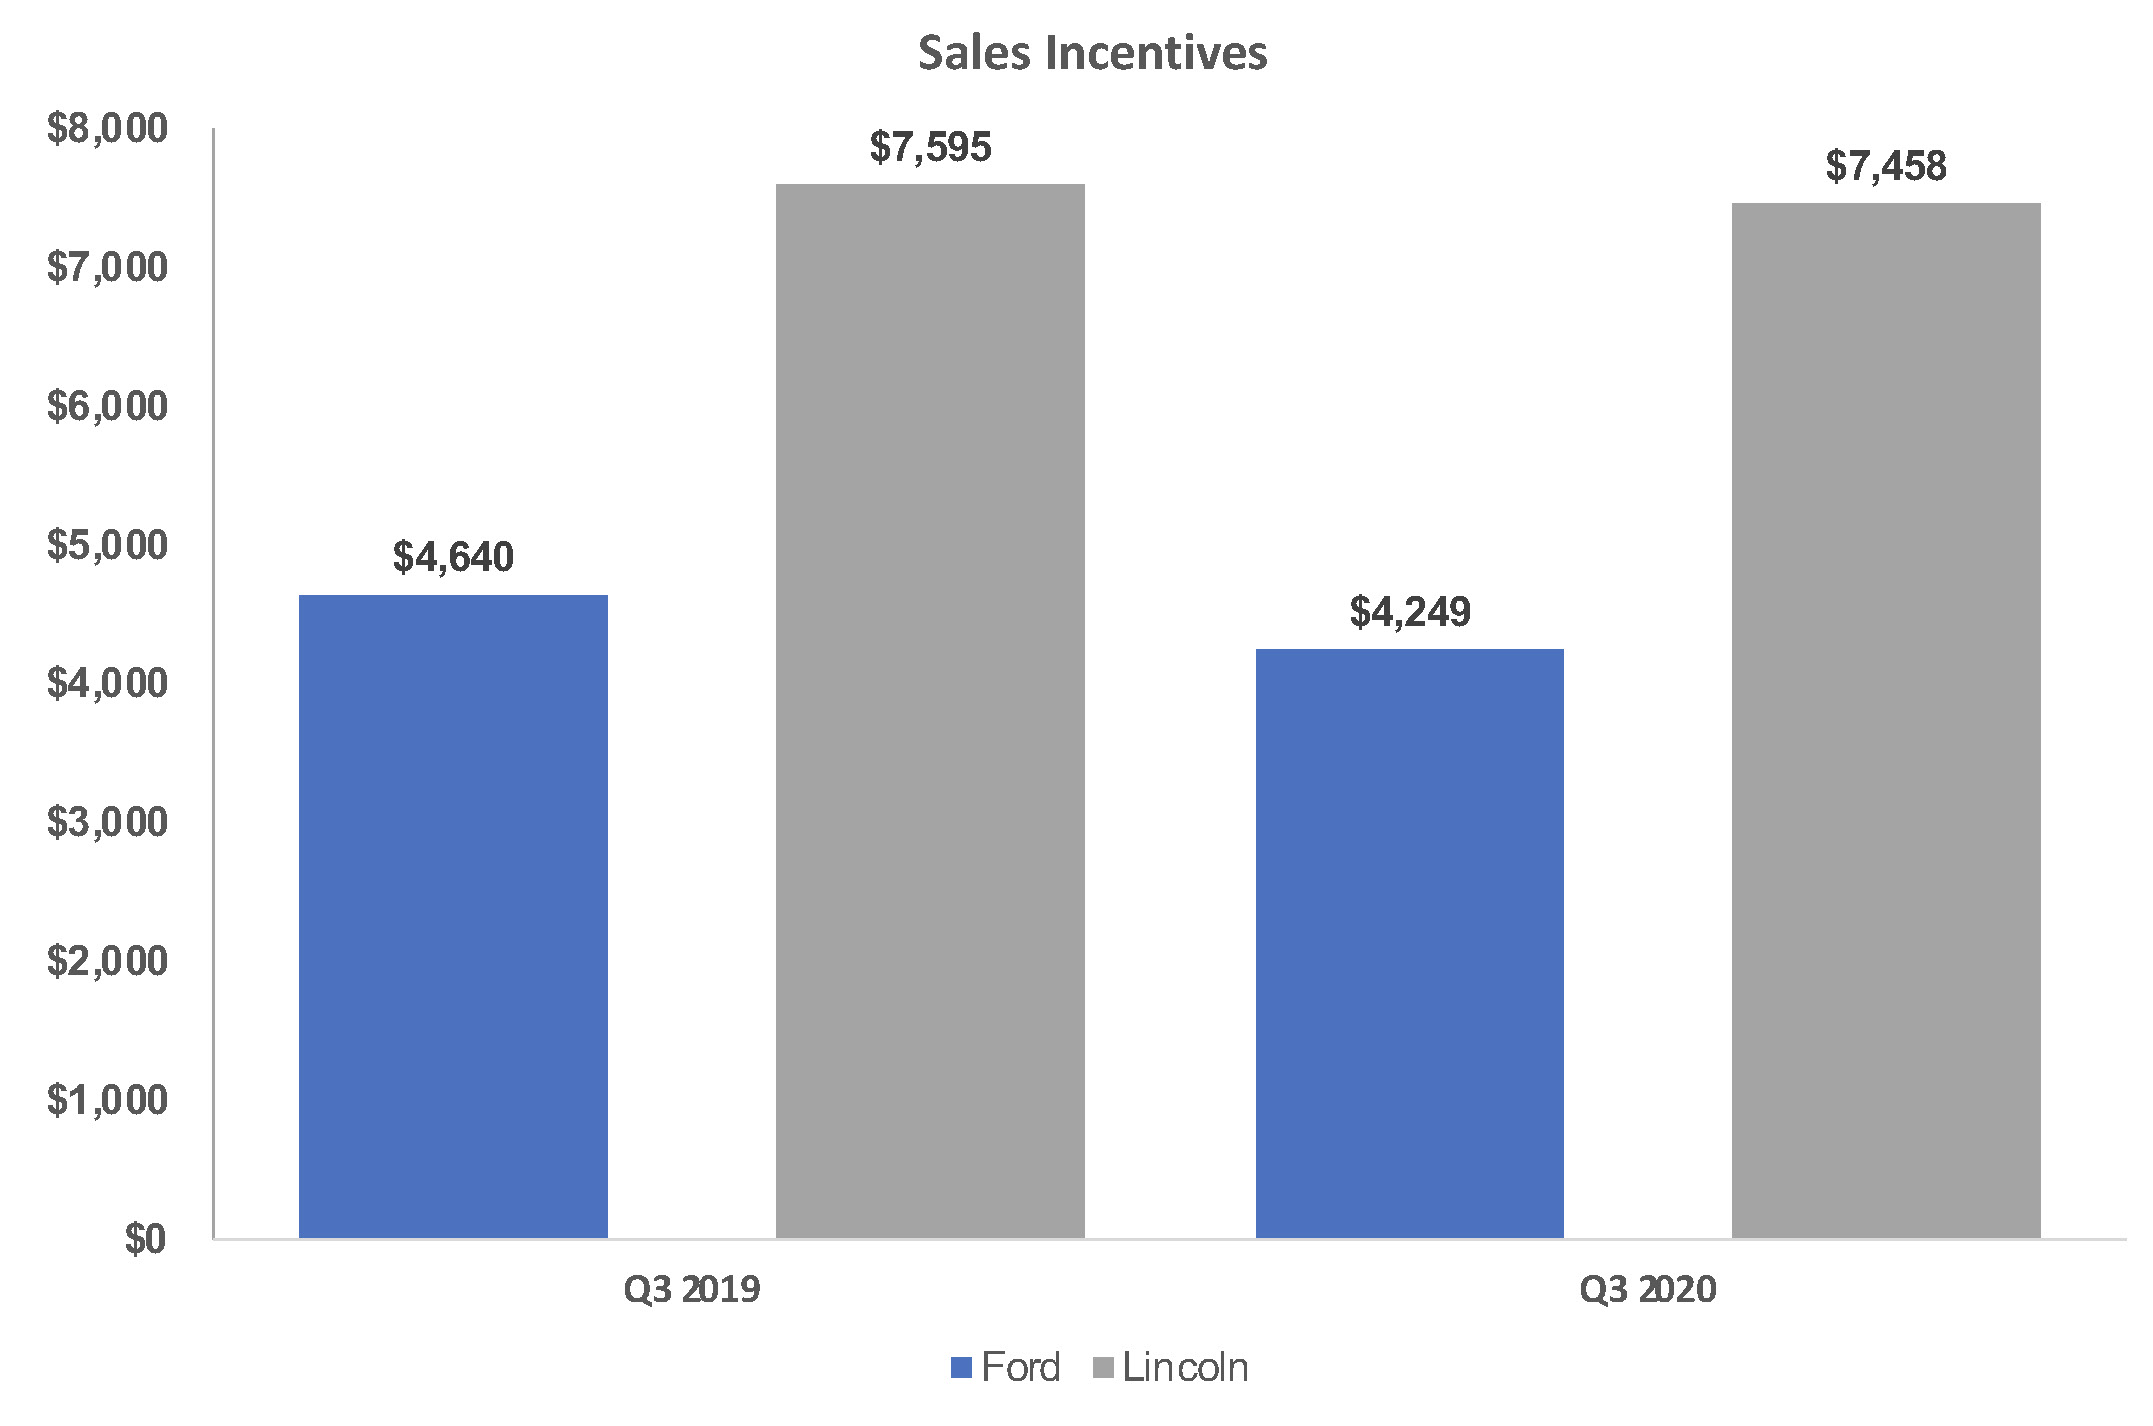
The Ford brand saw the biggest cut – down 8% to an average of $4,249 per vehicle. Lincoln cut incentives only 2%, leaving them at a very high $7,458 per vehicle.
Average Transaction Prices
Ford’s overall transaction prices rose nearly 8% to $45,891, the highest ATP for any third quarter in the past five years, according to Kelley Blue Book. Ford has eliminated traditional cars like the Fiesta and Focus to focus on more expensive and profitable vehicles like trucks and SUVs. It has revamped the Lincoln brand, making each new model more expensive and upscale than the vehicle it replaces.
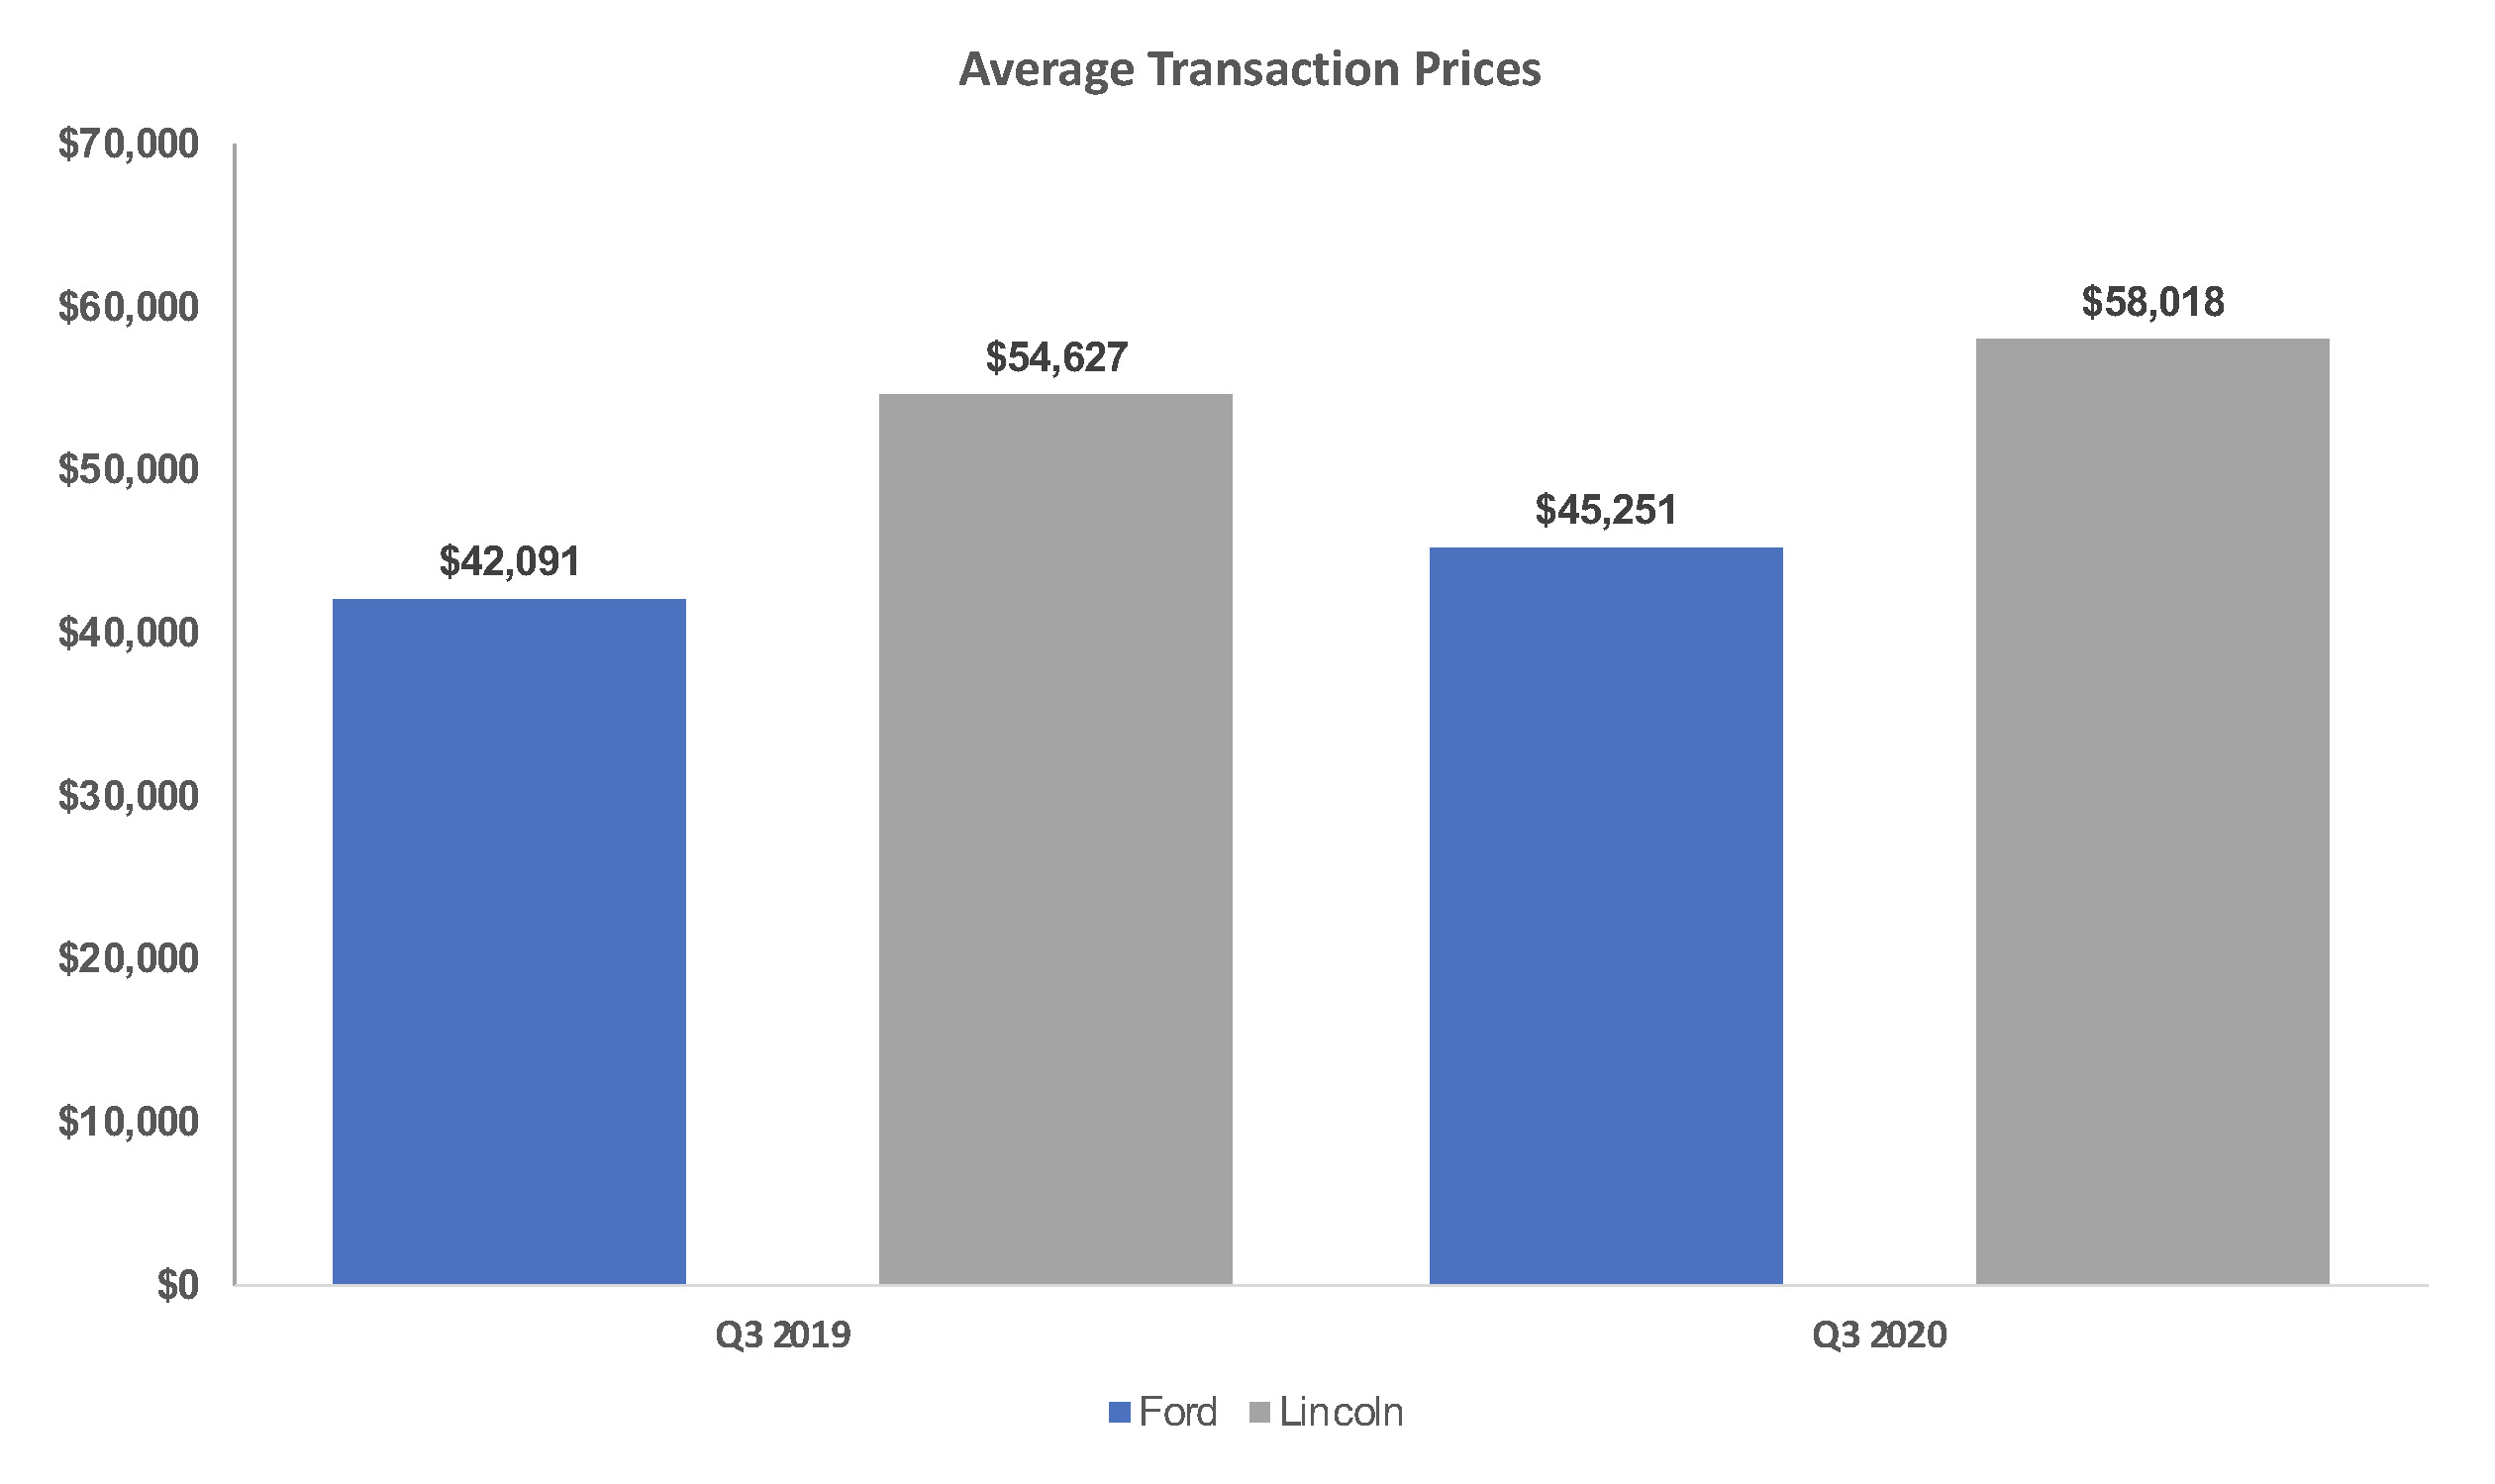
Ford brand’s ATP climbed nearly 8% to $45,251. Despite lower sales than a year ago, Ford Escape had an 8% increase in ATP, surpassing the $30,000 mark for the first time – $30 950 to be exact. The same was true for the Mustang. Sales were down significantly, but ATP was up 8%, pushing it past $40,000 – $42,567.
F-Series ATPs rose 3% to a five-year high of $53,251. Likewise, Transit cargo vans had a 12% increase in ATP to $43,275, its highest in five years. Explorer and Expedition also had higher ATPs.
Lincoln’s ATP increased 6% to $58,018, its highest in five years. The Corsair, which replaced the MKC, had an 11% gain in ATP to $44,462. Nautilus had a 4% rise in ATP to $52,807.


