
Hyundai Motor Company, which includes the Hyundai, Kia and Genesis brands, had a stellar second quarter in the U.S. despite low inventories, particularly Kia. The automaker boosted incentives to over $1,000, while average transaction prices were up incrementally compared with a year ago.
The U.S., where Hyundai Motor sells all three brands and Hyundai and Kia operate plants, is one of the most important markets for the automaker. Here are data points from Cox Automotive on the South Korean company’s U.S. Q2 market performance.
Hyundai Motor Brands Have Second-Best Second Quarter for Sales
Hyundai Motor reported sales of 437,826 units in this year’s second quarter, up 15% from the year-earlier quarter. This marks the second-highest sales for the automaker in the second quarter. All three brands saw sales increases for the quarter.
Hyundai Motor Company U.S. Sales Performance for Q2 2023
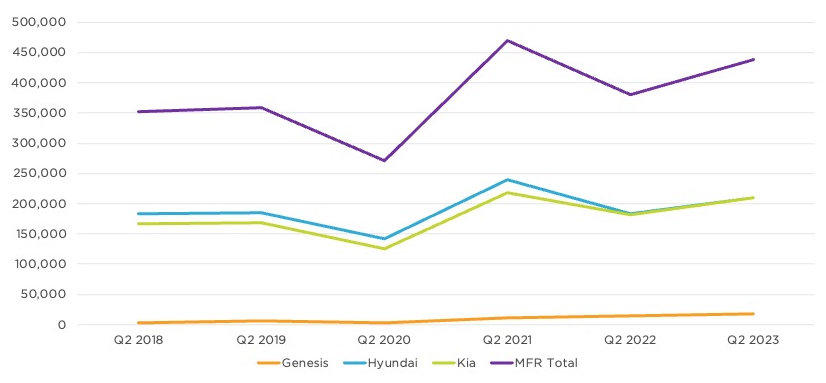
The Hyundai brand had sales of 210,164 vehicles, up nearly 14% from the year-ago quarter. Elantra sales surged by 58% to 42,265 vehicles. Tucson, Hyundai’s bestseller, was up 23% to 54,421 units. Santa Fe, Kona and Santa Cruz had single-digit sales increases. Palisade was down 12%. Hyundai sold 7,905 Ioniq 5 electric SUVs, a 6% year-over-year increase. The brand’s newest EV, Ioniq 6, sold 3,023 units for the quarter.
The Kia brand edged ahead of the Hyundai brand, selling 210,197 vehicles in Q2, up 15%. Sportage sales rose 12% to 40,205 units. Forte was up 11% to more than 31,000 units. Telluride had a 13% hike. Sorento was up 7%. Seltos subcompact SUV sales were up 114%, its best quarter ever. Kia sold 4,936 EV6 electric cars.
Genesis had sales of 17,465 vehicles, up 25%. The GV70, the brand’s biggest seller, was up 55%. The GV60 and G90 saw major gains of 130% and 247%, respectively. The GV80 was down 1% to 4,316 units.
Even with higher sales, Hyundai’s overall market share dipped by .16% for the quarter to 10.6%. Genesis is the only brand to see an increase in market share, albeit small. The Hyundai and Kia brands tied with 5.1% market share for the quarter.
Hyundai Motor Boosts Incentives by 115% to an Average of $1,330 per Vehicle
Hyundai Motor more than doubled overall incentive spending by 115% to an average of $1,330 per vehicle, up from an all-time low of $618 a year ago, according to Cox Automotive calculations. However, Hyundai Motor incentives remain well below the industry average of $2,048.
Hyundai Motor Company U.S. Incentive Spending for Q2 2023
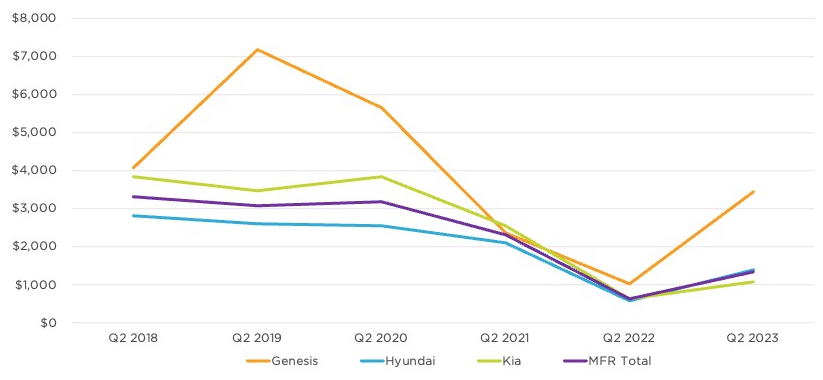
Kia incentives rose 71% to $1,082 per vehicle, up from $618 in 2022. Before the pandemic, Kia was spending more than $3,000 per vehicle.
The Hyundai brand increased incentive spending by 145% to an average of $1,402 per vehicle. Despite the increase, the average incentive is still historically low. In past years, Hyundai spent more than $2,000 per vehicle on incentives.
Genesis also boosted incentives by 234% to an average of $3,454 per vehicle. While higher than a year ago, Genesis is spending far less than in the past. Its incentives reached a quarterly high of over $7,000 per vehicle in Q2 2019.
Hyundai Motor Average Transaction Prices Rise Incrementally to $36,513
Hyundai Motor’s average transaction price (ATP) rose incrementally in the second quarter compared with a year ago at $36,513, according to Cox Automotive’s calculations. ATPs for the Hyundai and Kia brands were roughly flat, while Genesis got a boost.
Hyundai Motor Company U.S. Average Transaction Price for Q2 2023
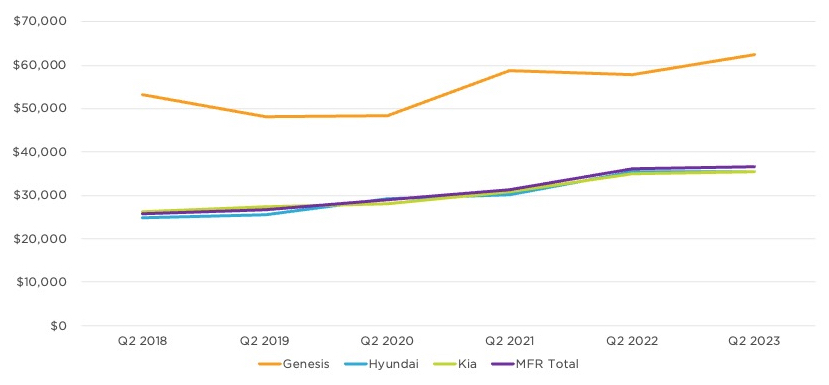
The Hyundai brand’s ATP was mostly flat at $35,507. ATPs by model rose only slightly or were flat. The Santa Fe truck was up 5% to $40,229. Elantra was up 2% to $26,568. The electric Ioniq 5 had a 1% increase in ATP to $53,618, surpassing Palisade’s ATP of just over $50,000.
The Kia brand rose a bit to $35,373. The Sportage SUV had an 8% boost in ATP to $35,567. Telluride was up 3% to $50,173. Other models held steady or decreased in price. The electric EV6 edged lower to an even $56,000, still Kia’s highest-priced model.
Genesis’ ATP rose almost 8% to an all-time high for the quarter of $62,340. The ATP for the GV80 was up 7% to $74,187. The G80 got a 16% boost to $67,837. The G70 is the brand’s lowest-priced model at just over $50,000 and was up 7% compared to Q2 2022.


