
To echo remarks by Nissan’s U.S. sales chief regarding recent quarterly vehicle sales, what a difference inventory makes.
Indeed, having much-improved inventory after last year’s computer chip shortage resulted in substantial sales increases for Nissan and Infiniti in the U.S. and should benefit Nissan Motor globally when quarterly financial results are posted on Nov. 9.
In the July-to-September quarter – the second quarter of the 2023 fiscal year – Nissan and Infiniti sales rose 41% due to improved supply and an extended range of models. As with all automakers in the U.S., Nissan raised incentive spending for the quarter, and prices softened. Nissan’s overall average transaction prices were down.
Here are some data points from Cox Automotive on Nissan Motor Corp.’s quarterly market performance in the U.S., one of its most important regions.
Nissan and Infiniti Sales Improve, up 41%
In July, August and September, Nissan Motor Corp.’s U.S. sales – combined Nissan and Infiniti brand sales – totaled 216,878, up a healthy 41% from a year ago and above the industry’s gain of 16%. Still, it was below Nissan’s pre-pandemic sales volumes in 2018 and 2019.
Nissan U.S. Sales Performance for Q2 Fiscal Year 2023
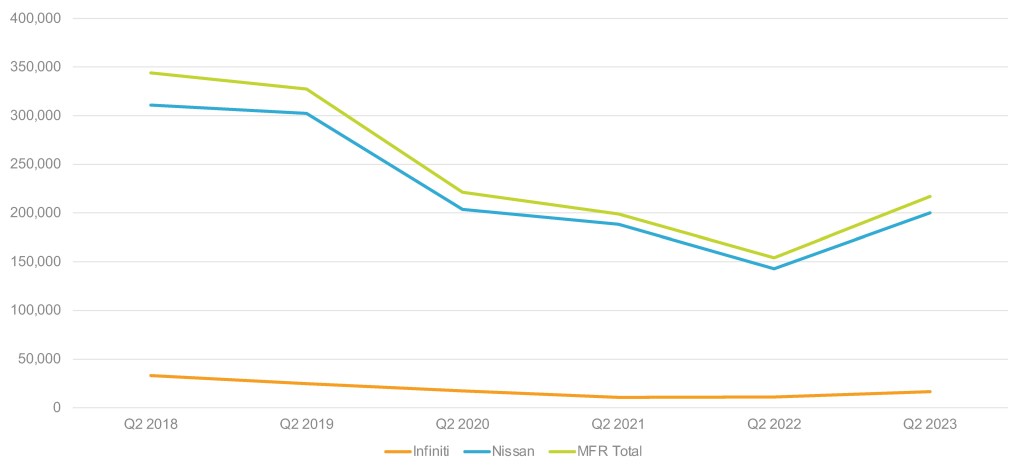
With increased sales, Nissan’s total market share rose to 5.5%, up 0.95 percentage points from the year before. Both brands saw increases in market share for the quarter. Nissan now holds a 5.04% market share, and Infiniti is at 0.42%, up 0.1% from the previous year.
Nissan brand sales totaled 200,334 vehicles, up a strong 40%. Nissan’s quarterly sales bump was driven by strength across its line. Rogue sales were up 49% to 63,346 units, while Armada sales were up 10% to 4,532 units. Attractive for their affordable price tags, the compact Versa increased sales to 6,835 units, an 84% jump, and the Sentra sold 31,612 units, a 70% increase, despite a transmission issue. The Nissan Titan pickup truck saw a sales gain of 281% to 6,835 units. The Maxima was up 95% to 2,493 units. The Ariya EV sold 4,504 units in the quarter.
Infiniti sales were up a healthy 47% to 16,544 units. Infiniti had four models with higher sales from the year before – the QX60 SUV with sales of 7,554 units, a 66% increase, the QX80 with a gain of 73% to 3,095 units, Q50 gained 256% to 1,827 units and the QX55 with sales of 1,419 units, an increase of 21%.
Nissan Raised Incentives to an Average of $2,337 per Vehicle
Nissan raised incentive spending, which is already generally high for the industry. In total, incentive spending year-over-year was boosted by 74% to an average of $2,337 per vehicle, according to Cox Automotive calculations. Industrywide, automakers spent, on average, $2,368 per vehicle, the highest amount in the last 24 months.
Nissan U.S. Incentive Spending for Q2 Fiscal Year 2023
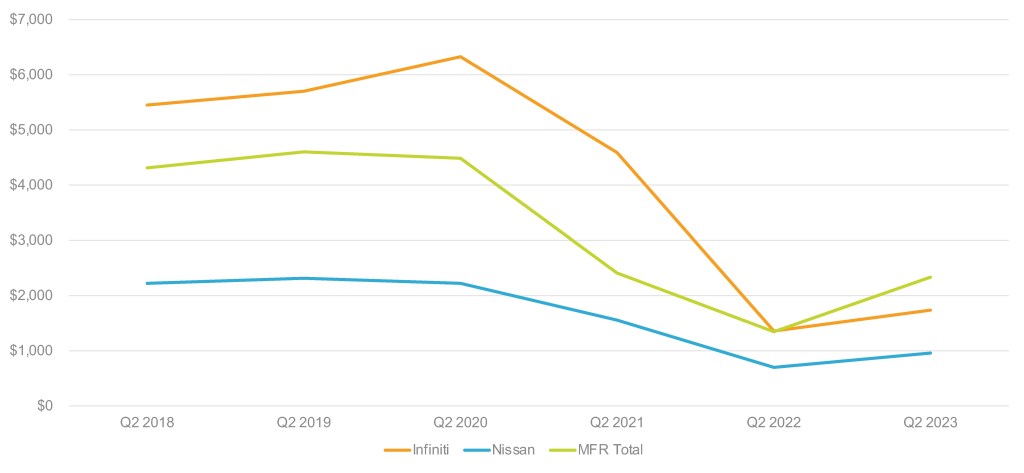
Nissan brand incentives increased by 64% to an average of $2,059 per vehicle, up from last year’s average of $1,259.
Infiniti incentives were up a whopping 134% to an average of $5,711 per vehicle, coming closer to pandemic-level incentives, which reached as high as $7,000 per vehicle.
Nissan’s Average Transaction Price Dropped by 2% to $36,435
The Nissan brand’s average transaction price (ATP) was down 2% year-over-year to $34,502. Most of Nissan’s models showed ATP decreases, from the Altima at 1% lower to the Leaf off 14%, according to Cox Automotive calculations.
Nissan U.S. Average Transaction Price for Q2 Fiscal Year 2023
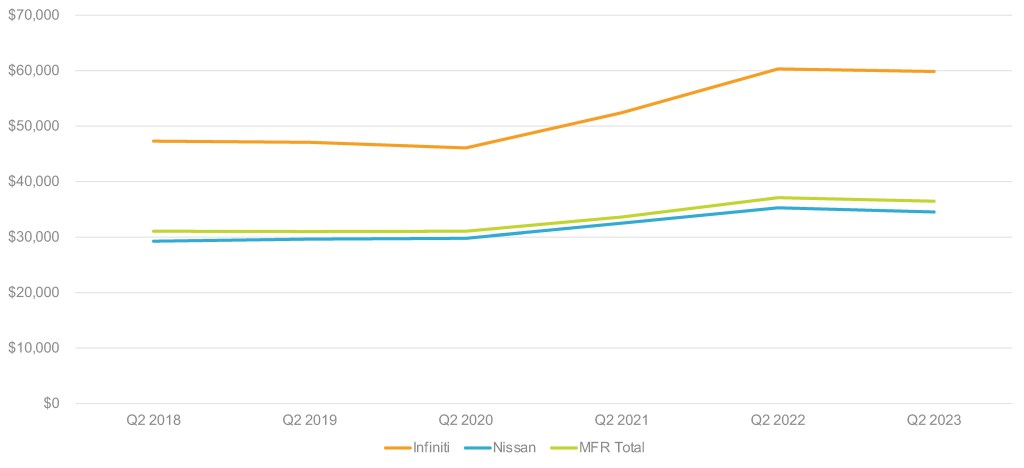
Infiniti’s ATP was also down by 1% to $59,839. Almost all models saw ATP drop between 0.8% to 5.2%. Only one model, the QX50, was up only 0.2%.


