
Toyota broke its U.S. sales slump in the most recently ended quarter but barely, as the Japanese automaker continued to have one of the lowest inventory levels in the industry, limiting sales.
In Japan, Toyota Motor Corp. posts financial results Aug. 1 for the April-to-June quarter, the automaker’s first quarter of its 2024 fiscal year.
Toyota’s U.S. sales for the quarter rose 7%, still underperforming the overall industry. Toyota brand sales edged 5% higher. Lexus sales rose 22%. On the plus side, the tight inventory kept Toyota from having to offer hefty incentives, which were just over $900 per vehicle. Average transaction prices stayed strong.
Here are some data points from Cox Automotive on Toyota’s quarterly market performance in the U.S., one of its most important markets.
Toyota’s U.S. Sales Increased, But Market Share Declined
Toyota Motor’s U.S. sales totaled 568,962, up 7% from a year ago. With overall U.S. sales up 15%, Toyota’s total market share dipped to 13.8%, down 1.3 percentage points. For comparison, Toyota’s share was 15.58% in the equivalent 2021 quarter.
TOYOTA MOTOR CORP. U.S. SALES FOR Q1 FISCAL YEAR 2024
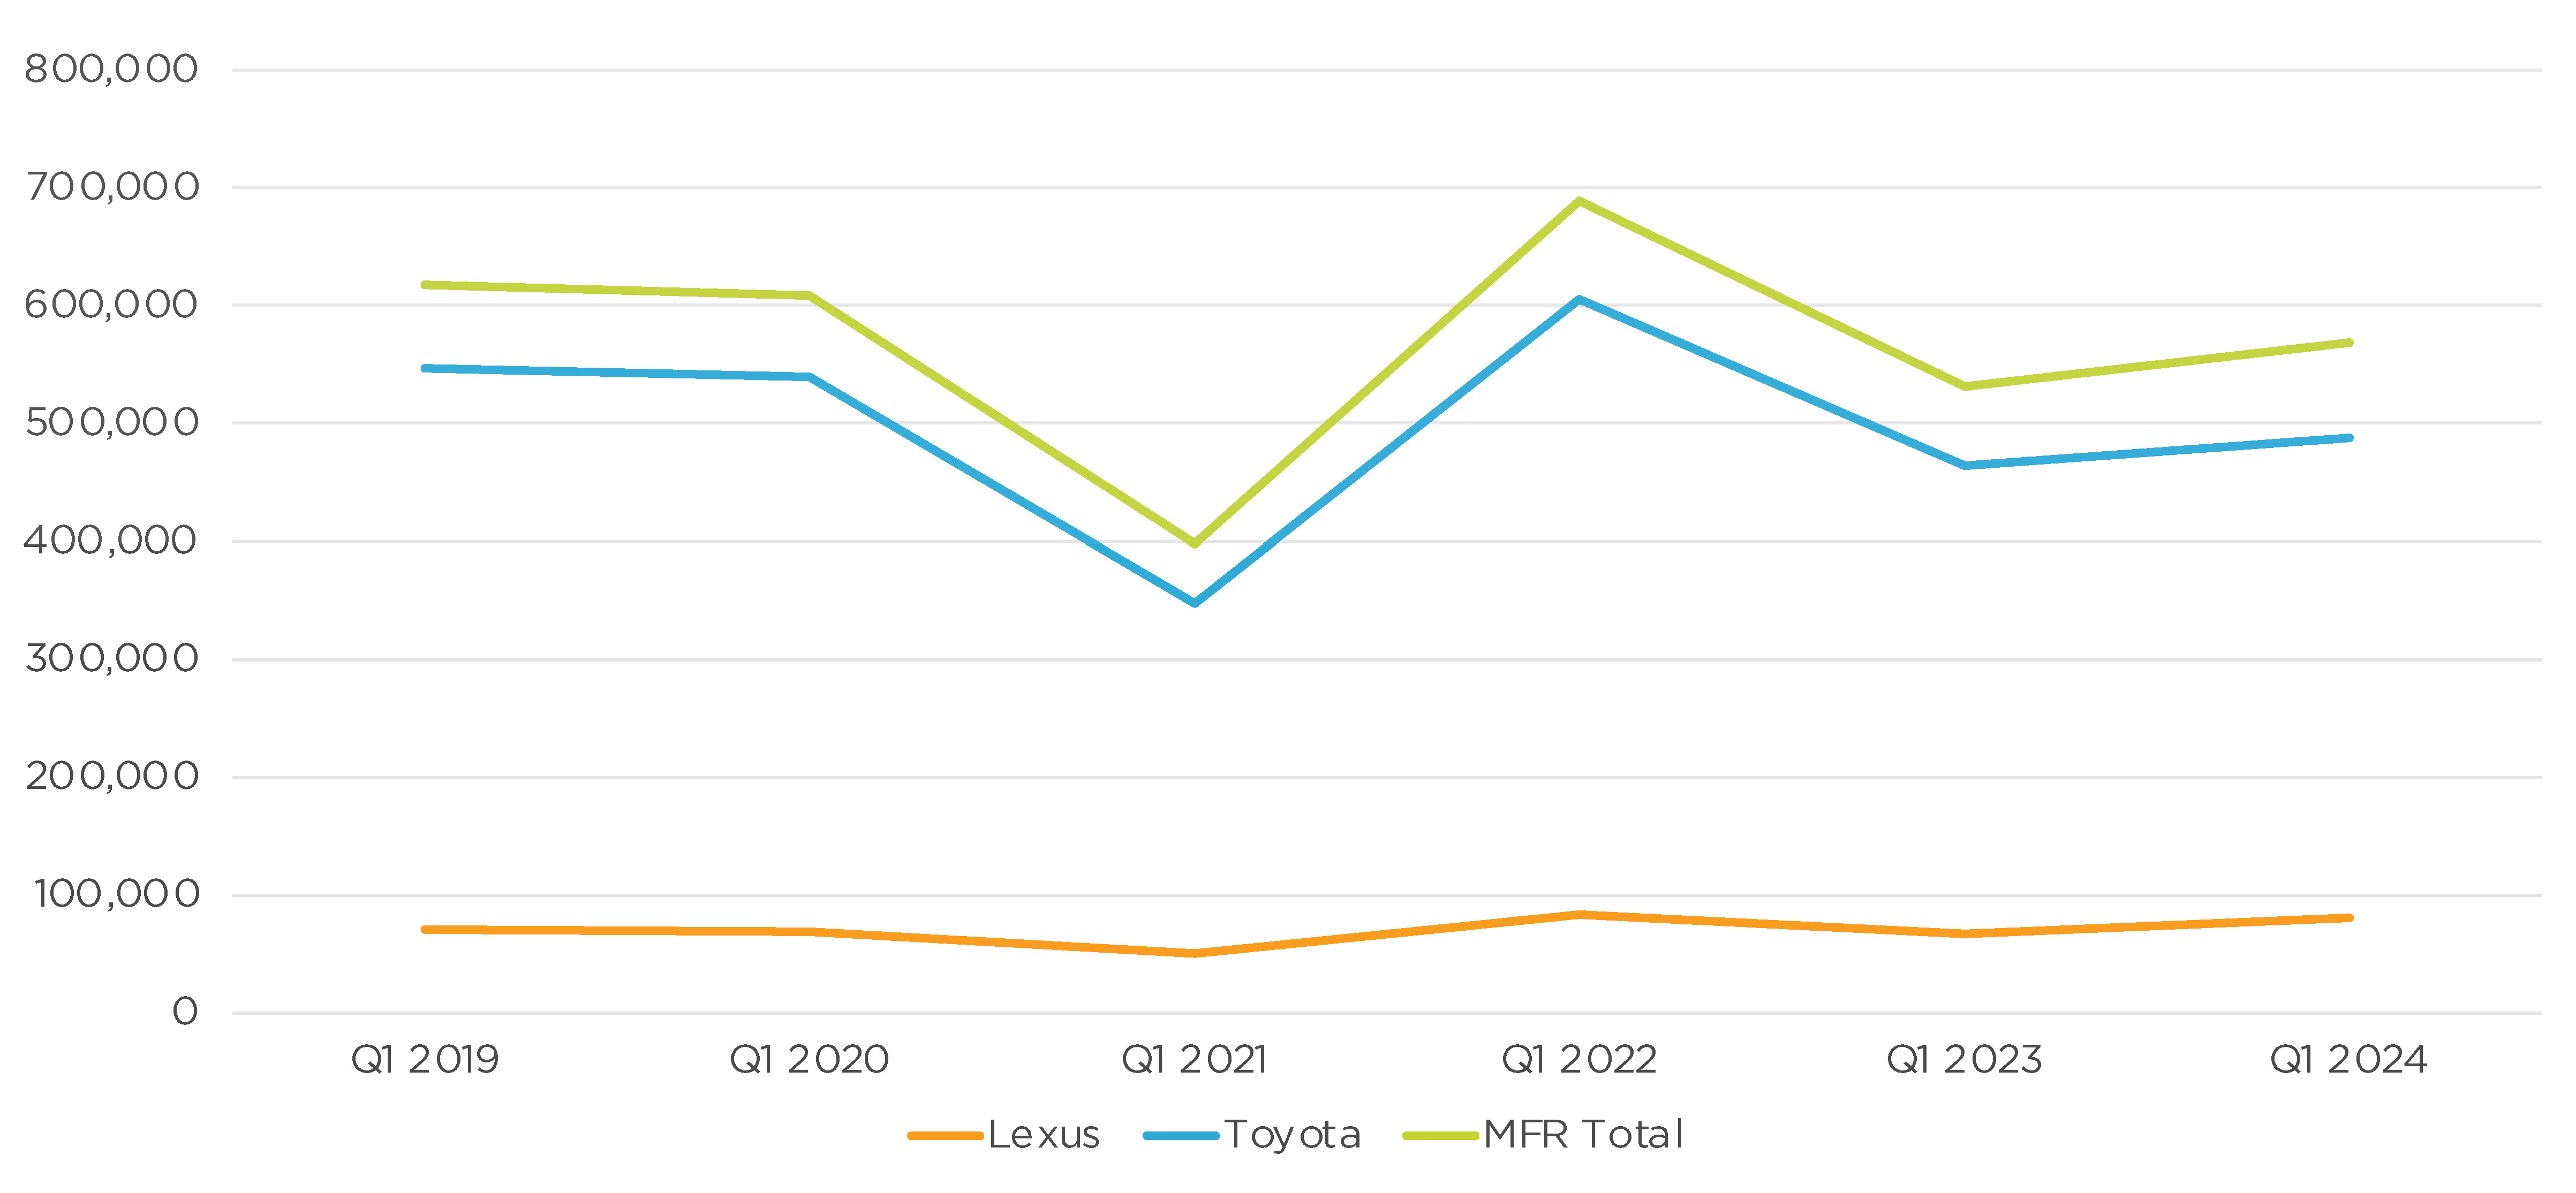
Toyota brand sales totaled 487,802 vehicles, an increase of 5% year over year. The Toyota brand accounted for all of the automaker’s market share decline in the U.S.
Still, sales of Toyota’s most popular models posted increases. The redesigned Sequoia saw the most growth, with sales up to 5,193 units versus 55 units in the same quarter a year ago as production of the all-new full-size SUV was getting underway. The Highlander SUV was up 13%. Sienna sales climbed 22%. The Camry and Corolla Cross both saw a 14% sales bump to 84,705 units and 13,822 units, respectively. RAV4, the brand’s best-selling model, had sales edge up 3% to 102,313 units in the quarter.
Toyota’s electrified models – EVs, fuel cells and hybrids – saw major gains. The electric bZ4X was up a whopping 745% year over year. The Mirai fuel cell vehicle was up 64% to 1,054 units, marking the first time that the Mirai sold more than 1,000 units in the quarter. On the flip side, the Prius hybrid, in short supply as the all-new model begins to become available, suffered a decline of 6%.
Lexus sales rose by 22% to 81,160 units for the quarter. The luxury maker’s share crept up by just 0.1% from the year-earlier quarter. The LX saw a 51% sales gain, selling 1,874 units. The NX was up 94% to 18,482, the UX was up 58% to 3,610, and the new electric RZ sold 932 units. The ES, GS, IS, LS and RC all had declines for the quarter.
Incentive Spending Slashed While Demand Remains High
Toyota Motor bumped up incentives by 16% to an average of $922 per vehicle, according to Cox Automotive calculations.
TOYOTA MOTOR CORP. U.S. INCENTIVE SPENDING FOR Q1 FISCAL YEAR 2024
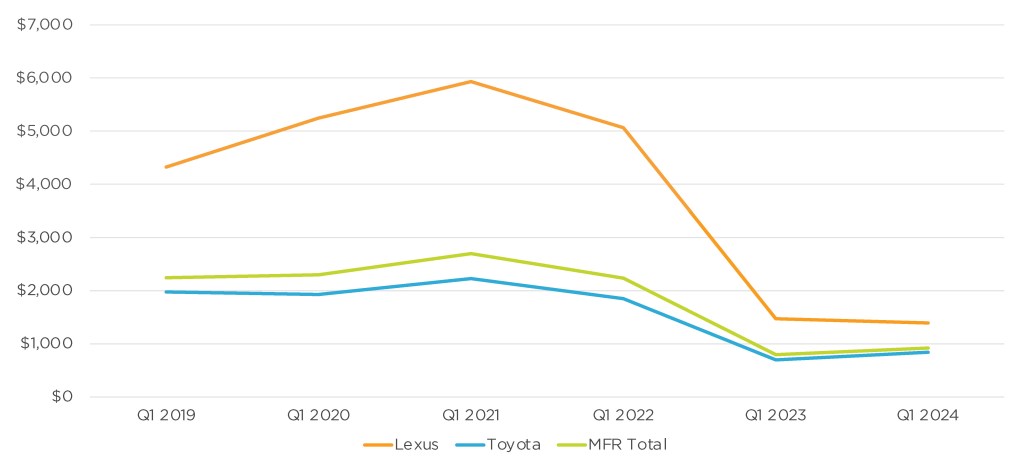
Toyota brand incentives grew by 21% to an average of $844 per vehicle. Lexus incentives were reduced by 6% to an average of $1,393 per vehicle, marking the second time that incentives were around $1,000 for the quarter. Compared to overall industry numbers, Toyota and Lexus incentive spend continues to be far below average.
Overall Average Transaction Price Remains Above $40,000
Toyota Motor’s overall average transaction price (ATP) was up 8% to $42,808, according to Cox Automotive calculations.
TOYOTA MOTOR CORP. U.S. AVERAGE TRANSACTION PRICE FOR Q1 FISCAL YEAR 2024
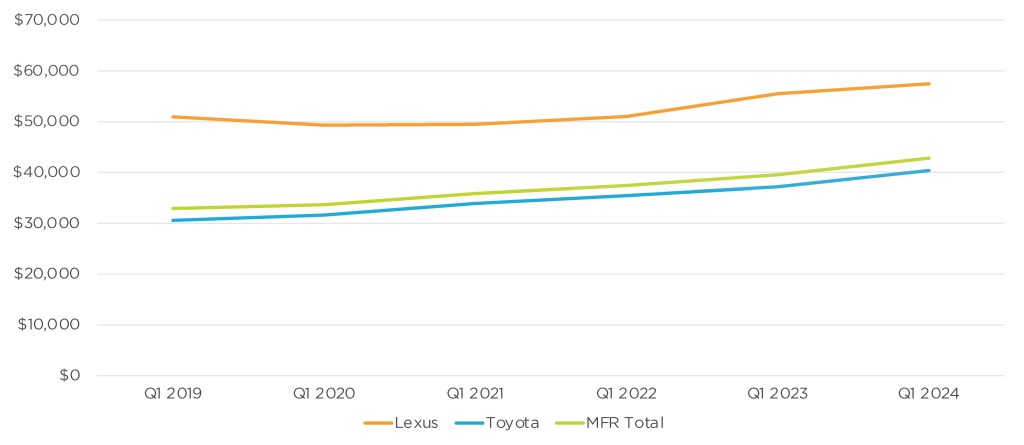
The Toyota brand’s ATP was up 9%. The all-new Sequoia had the highest price increase, up 20% to $80,128 from $66,894 in 2022. The Sienna had an ATP hike of 11%. All other offered models saw incremental gains or losses in the single digits.
Lexus brand ATP was up 4% for the quarter. The RC and UX models saw the biggest increase of 10%. The IS price increased by 7%, while the LS and LX were up 4% and 5%, respectively. The rest of the lineup showed incremental gains except for the NX, down 0.8%.


