Data Point
Cox Automotive Analysis: Toyota Quarterly U.S. Market Performance
Thursday November 4, 2021
Article Highlights
- Toyota Q3 sales edge up in a down market, surpassing GM.
- Toyota incentives were slashed by 28% to under $2,000 per vehicle.
- Toyota ATP rose nearly 9% to $39,145.
Toyota’s financial results for the recently ended quarter will be posted on Friday, November 5. The July-to-September period marks the second quarter of Toyota’s fiscal year that ends March 31, 2022.
Toyota has weathered the chip shortage better than most. In August, the automaker announced it would reduce its global production plans for September and October by 40%. Recently, the automaker said the worst was behind it, trimming the November production schedule by about 15% and then moving towards full production.
In the U.S., Toyota gained sales when the industry was down, boosting market share. At the same time, it slashed its cost of incentives and garnered richer average transaction prices. Tied together, those factors bode well for Toyota’s bottom line.
Here are key data points from Cox Automotive on Toyota’s quarterly performance in the U.S. market, where the company derives a significant share of its profits.
Sales and market share
Toyota made U.S. history, surpassing General Motors in sales for two straight quarters.
Toyota sold 566,005 vehicles, up 1% from the year-ago quarter, while GM sales plunged 33% to 443,117 units. In fact, the Toyota brand alone outsold all of GM.
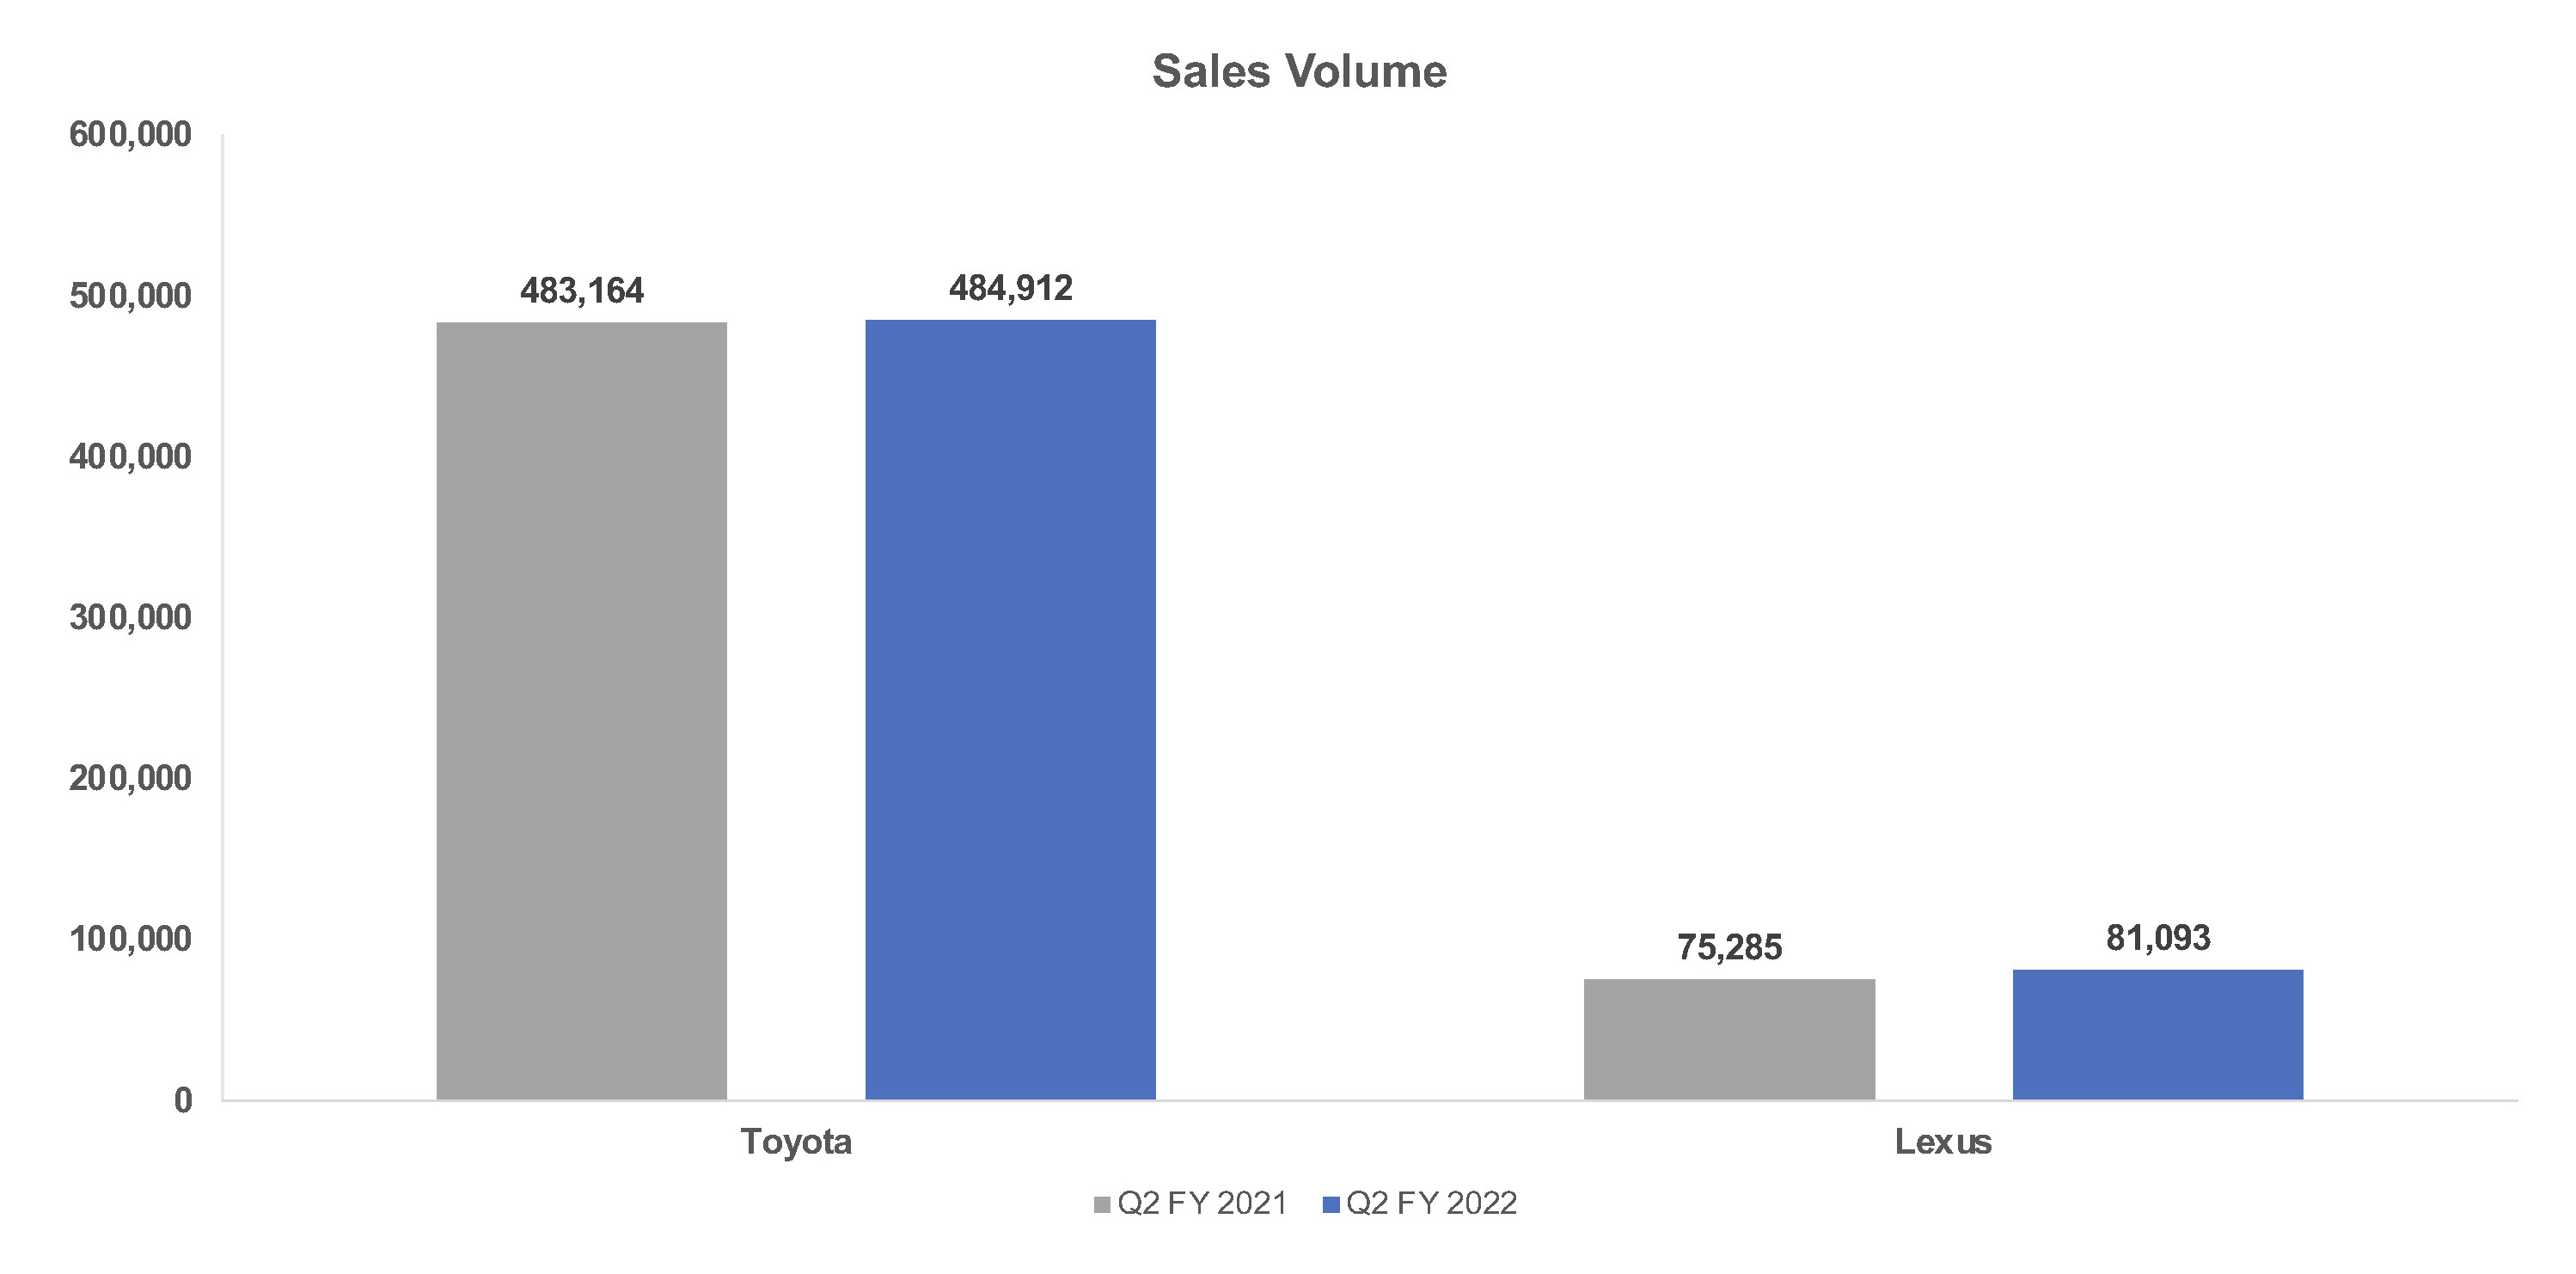
The Toyota brand sold 484,912, up by around 1,000 units from the year-ago quarter.
Sales Volume
Toyota’s top-selling RAV4, which has been in extremely short supply, had a 23% sales drop. Toyota’s other volume model, the Camry, was about flat compared to a year ago. Tundra was down 24% as Toyota converted its plant to the redesigned version going on sale by year-end. CH-R was down 35% on extremely low inventory.
Top Models by Sales Volume
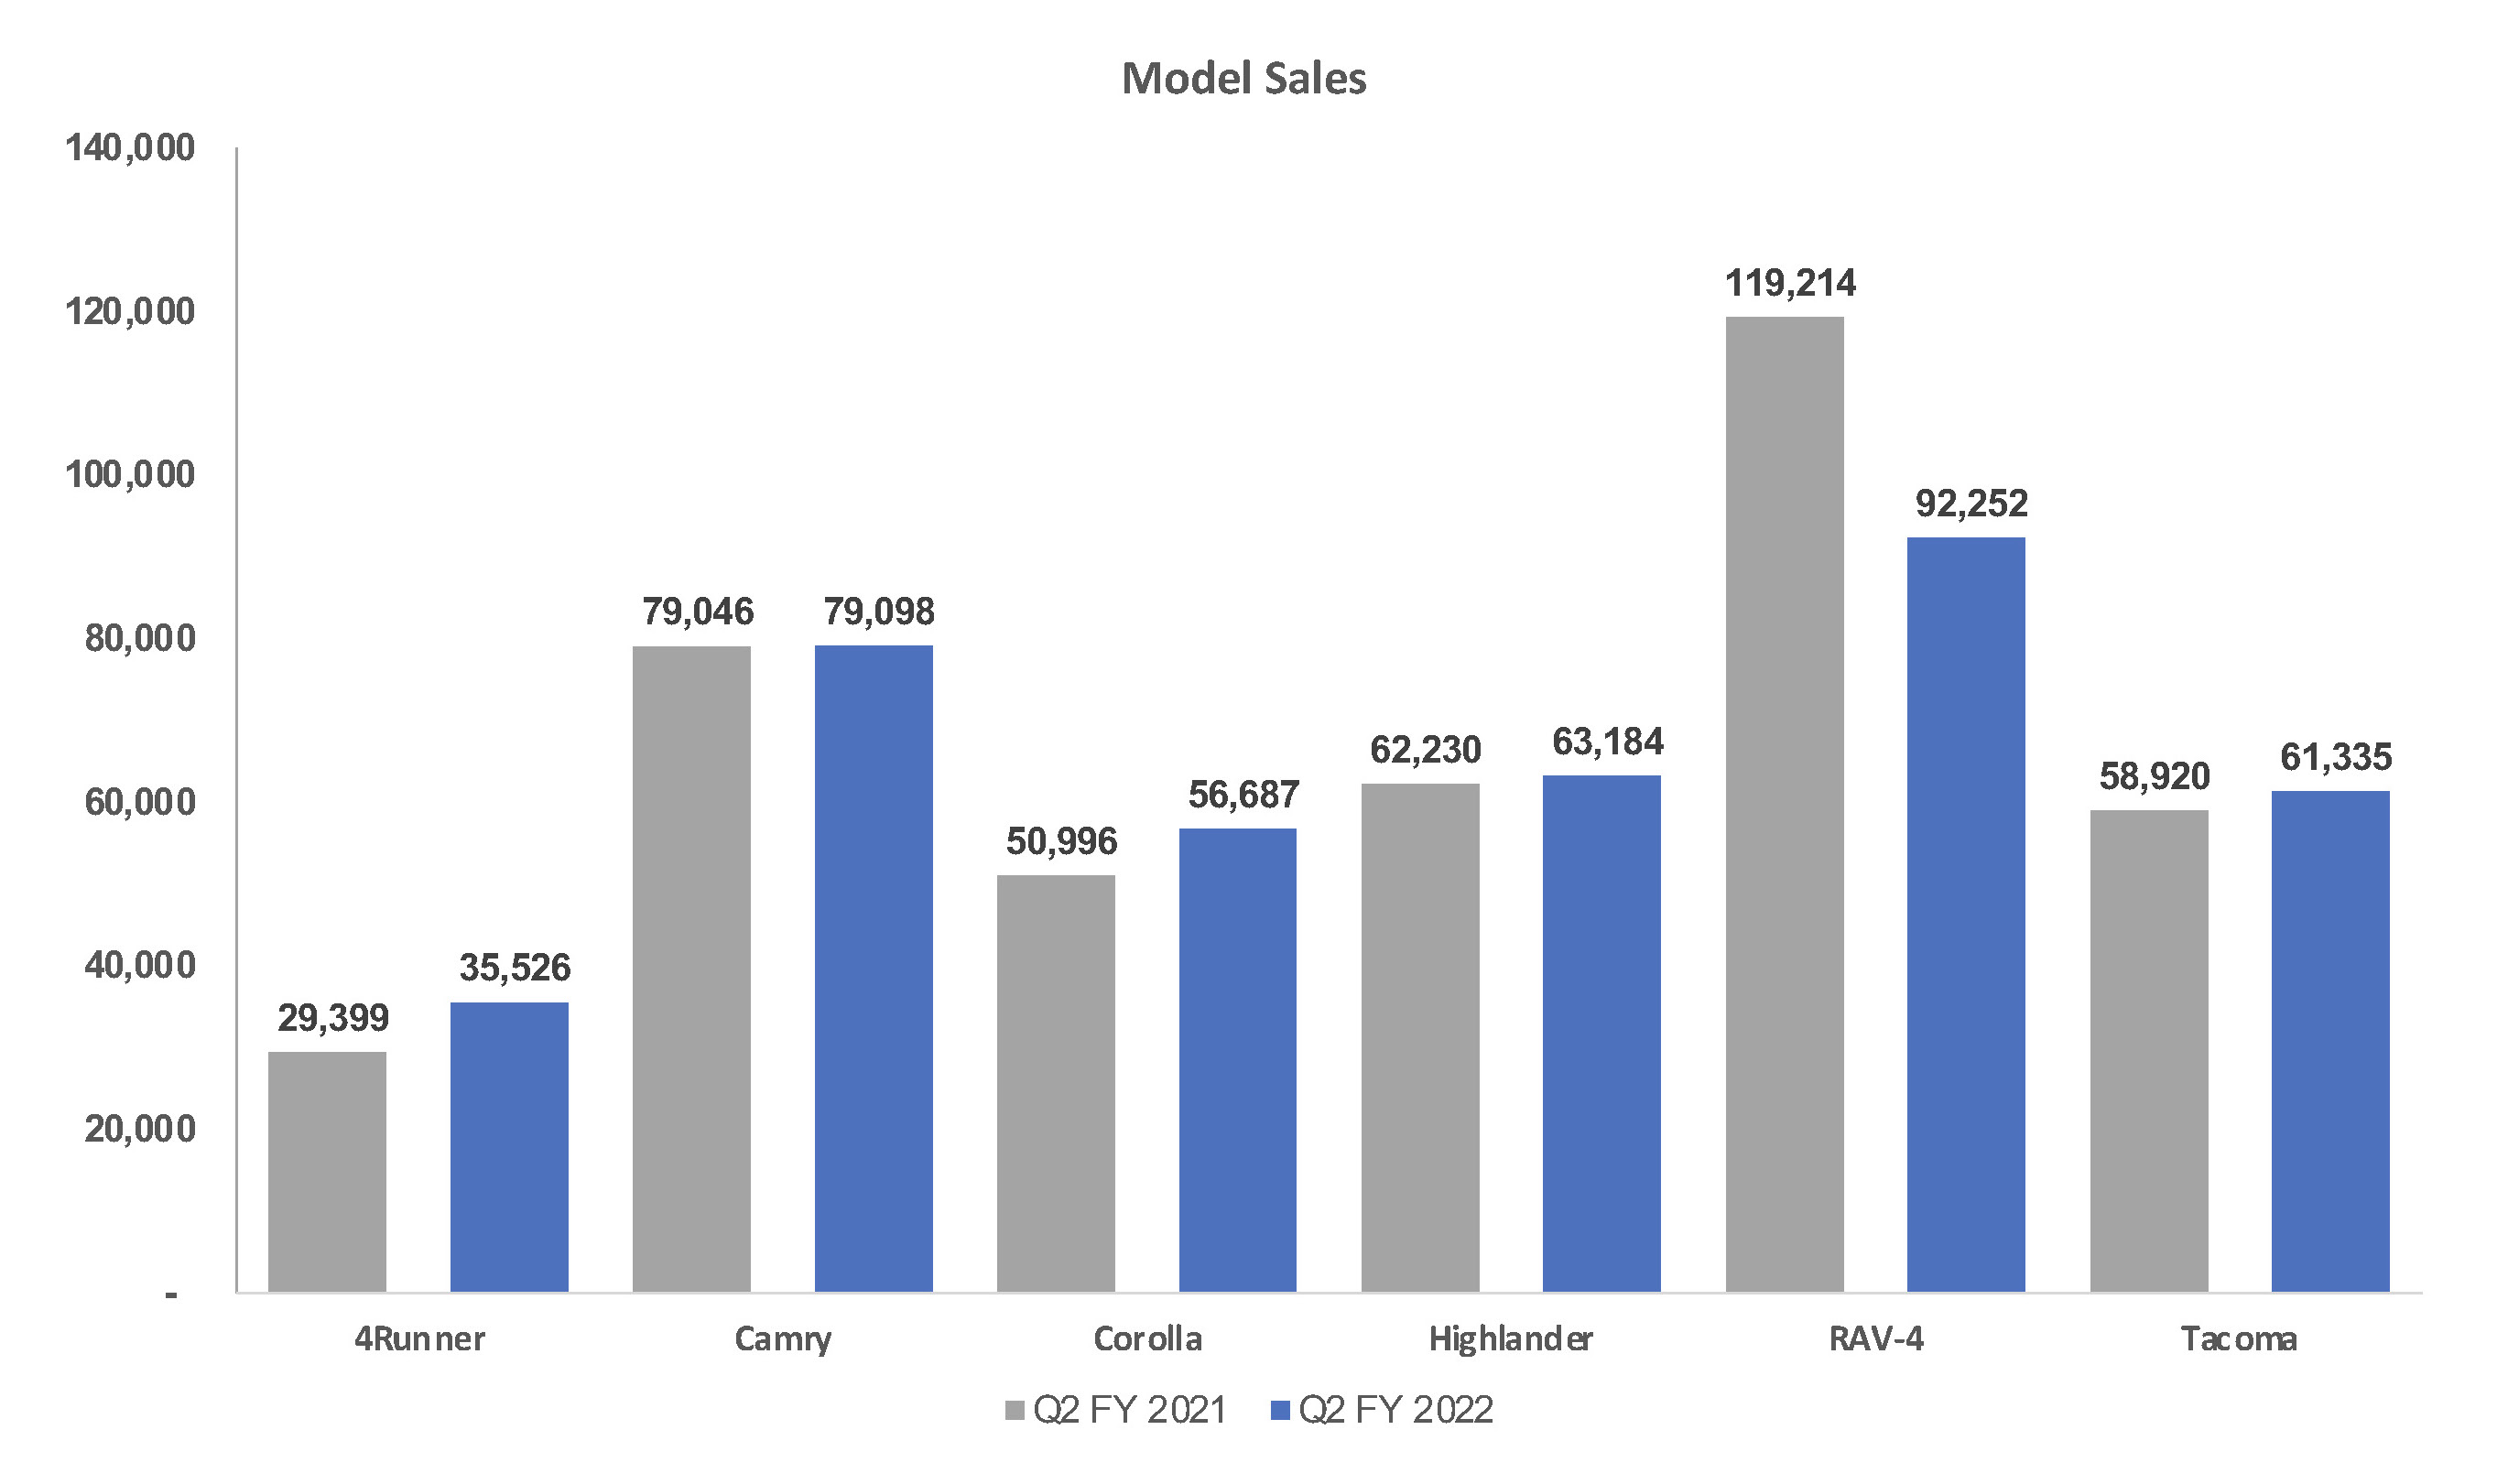
Other Toyota models had significant gains. The new Sienna hybrid-only minivan had a 123% sales increase. The 4Runner was up 21%. The new Venza kicked in nearly 15,000 sales. Corolla was up 11%. Highlander and Prius were each up 2%. Tacoma was up 4%.
Lexus sales rose 8% to 81,093 vehicles, its highest sales since the third quarter of 2017. The luxury market in total was down 5% in the quarter. The top-selling Lexus RX, despite extremely low inventory, had only a 5% sales decline, just shy of 28,000 units. The No. 2 volume vehicle, the NX, had a 40% increase in sales. Also up significantly were the IS, up 87%, and the GX, up 16%.
Toyota’s higher sales in a market that was down 13% caused the automaker to gain market share. In total, the company had a market share of 16.7%, up 2.4 percentage points from the year-ago quarter. Toyota brand share was 14.3%, up 2 percentage points. Lexus market share edged higher to 2.4% from 1.9%. It was the highest share for Toyota and its brands ever.
Incentives
Toyota is always at the lower end of the incentives spend spectrum, and it cut incentives even deeper in the quarter. In total, Toyota incentives were cut by 28% to an average of $1,994 per vehicle, according to Cox Automotive calculations. It was the first time in six years of the quarter that its incentives dropped below $2,000 per vehicle.
Sales Incentives
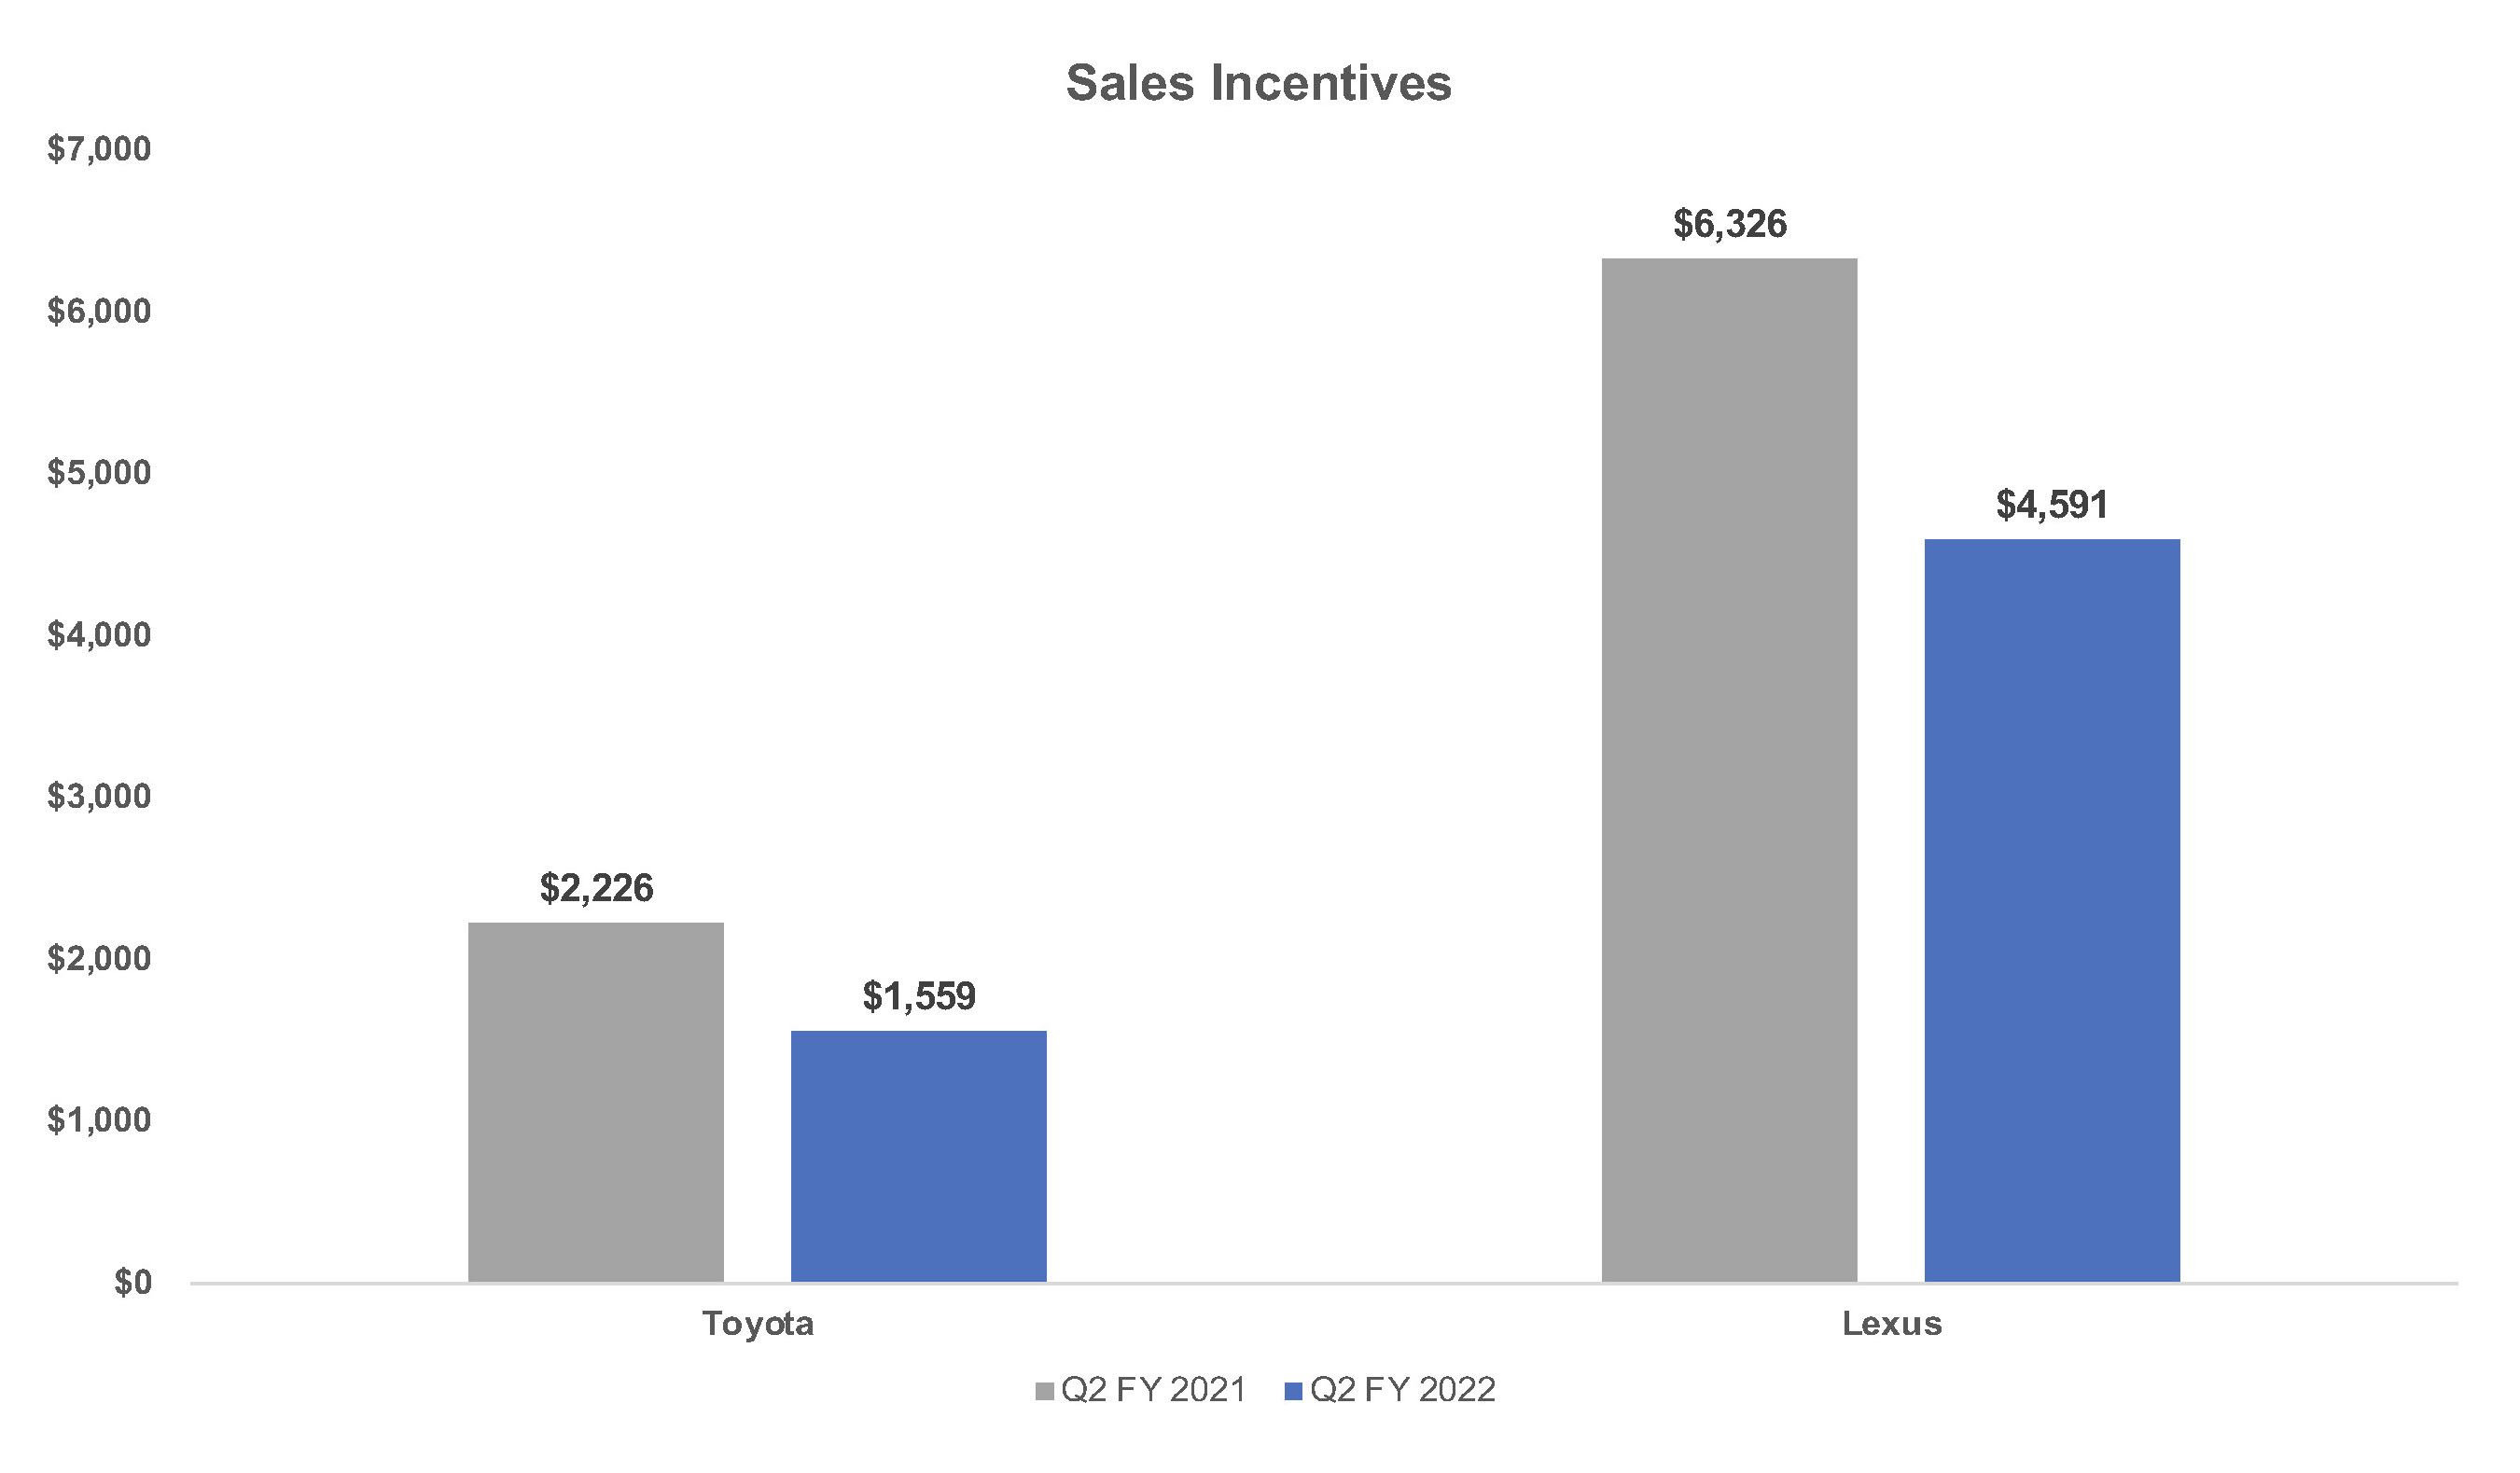
Toyota brand incentives fell to their lowest level in at least six years, down to an average of $1,559 per vehicle. Lexus cut incentives to an average of $4,591 per vehicle, the lowest since the third quarter of 2016.
Average Transaction prices
Toyota’s overall average transaction price (ATP) rose nearly 9% to $39,145, according to Cox Automotive calculations.
Average Transaction Prices
Toyota brand’s ATP climbed over 9% to $37,019, with every model gaining in price. Its highest-priced model, the Land Cruiser, had a 13% decrease to $72,603. However, the big SUV is being discontinued in the U.S. That will leave the Sequoia SUV as Toyota’s most expensive model, which saw its ATP climb to just shy of $65,000. The new Sienna minivan had the biggest hike, up 12% to $44,401.
Lexus had a 3% gain in its ATP, which amounted to $51,858. Every model gained except the LS, which was off less than 1%. The IS had the biggest hike with a nearly 10% increase to $46,841. The LC and LX had gains to their ATPs, which were already above $100,000.