Data Point
Cox Automotive Analysis: Toyota Motor Corporation’s Quarterly U.S. Market Performance
Wednesday February 8, 2023
Article Highlights
- Toyota Motor Corp. quarterly sales were up 13% from a year ago for a 14.9% market share.
- Overall incentives were slashed by 49% to an average of $631 per vehicle.
- Toyota Motor Corp.’s average transaction price fell 0.4% to $40,721.
Toyota Motor Corporation posts financial results for the October-to-December quarter on Wednesday, Feb. 8, the automaker’s third quarter of its fiscal year. Like its Japanese competitors, Toyota Motor North America has had one of the lowest inventory levels in the U.S. for the past year, including the most recent quarter.
Throughout the past calendar year, including the recent quarter, Toyota Motor Corp. was selling cars as fast as it could make them. But General Motors had more inventory to sell, allowing the U.S. automaker to take back its sales crown from Toyota for the full year.
In the U.S., one of Toyota Motor Corp.’s most important markets, sales for the final quarter of the calendar year were up close to 17% for the Toyota brand but down for Lexus by 9%, as Toyota’s luxury nameplate missed out on relatively strong sales in the final quarter of 2022 due largely to tight inventory levels. The automaker has already increased production by finding alternative suppliers for chips and hopes to restock inventory. Toyota Motor Corp.’s bottom line should be helped by a drastic reduction in incentives, but its average transaction price held mostly steady while other automakers saw significant increases.
Here are some data points from Cox Automotive on Toyota Motor Corp.’s quarterly market performance in the U.S.
Toyota Motor Corp.’s U.S. Sales and Market Share Increases Year Over Year
Toyota Motor Corp.’s U.S. sales totaled 536,740, up 13% from a year ago, approaching pre-pandemic numbers. Toyota’s total market share rose slightly to 14.9%, up 0.5 percentage points. This is the second-highest market share in recent years, only behind 2020, when it was 15.7%.
TOYOTA MOTOR CORP. U.S. SALES FOR Q3 FISCAL YEAR 2023
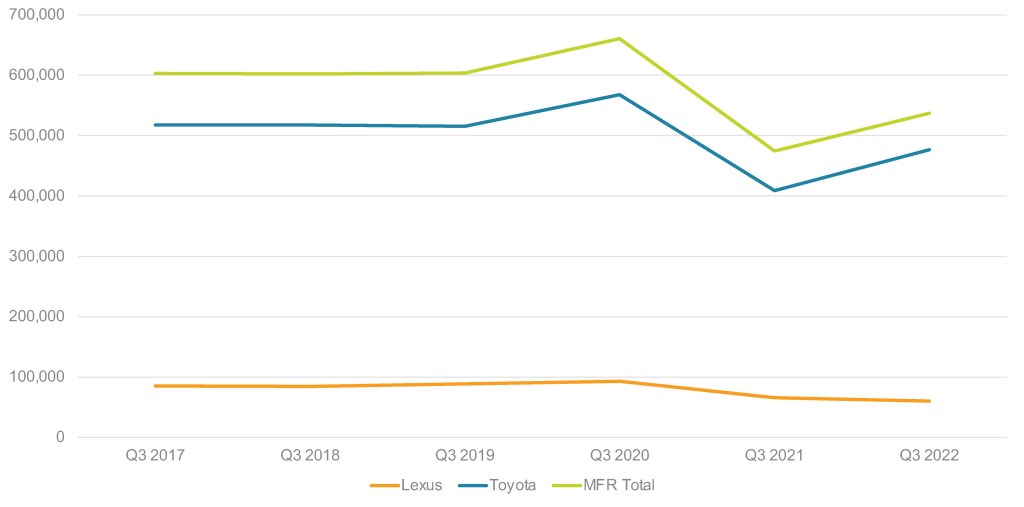
Toyota brand sales totaled 476,648 vehicles, up close to 17%. Toyota brand had all but five models on the plus side of sales, signaling a strong quarter. The 86 sports car saw added 2,305 units to the bottom line this quarter versus 108 units a year ago, when the vehicle was initially launched. The newer Corolla Cross saw a 165% sales hike, with 19,145 units sold for the quarter, and the Corolla hatchback saw an increase of 126% in sales, with 3,851 units sold. Toyota’s big SUV, the Sequoia, saw a gain of 145%, selling 4,806 units for the quarter. Toyota’s pickups, the Tacoma and Tundra, also had sales gains, with the Tacoma selling 61,451 units, an almost 18% increase, and the Tundra selling 29,727 units, a 75% increase.
Sales of electrified models, such as the Mirai fuel cell car and Prius hybrid, were up 82% and 24%, respectively. The models that saw declines were the discontinued models – Avalon, Land Cruiser and CH-R – along with the Sienna and Venza, both hybrids, which were down 18% and 8%, respectively, for the quarter due to low inventories.
Lexus sales dropped by around 9% to 60,092 units. Its market share was down 0.3% in the quarter. The LX saw a 24% gain, selling 933 units versus 755 units in 2021. The IS saw an almost 175% increase to 1,922, the LS was up 62% to 223 units, and the NX was up 118% to 6,088. The RC sports car was up 161% to 207 units. The ES, GX, LC, RX and UX all had declines for the quarter.
Incentive Spending Slashed While Demand Remains High
Toyota Motor Corp. slashed incentive spending as demand remained high. In total, Toyota cut incentives by 49% to an average of only $631 per vehicle, according to Cox Automotive calculations. It was the first time since 2017 that incentives averaged below $1,000 per vehicle for the quarter.
TOYOTA MOTOR CORP. U.S. INCENTIVE SPENDING FOR Q2 FISCAL YEAR 2023
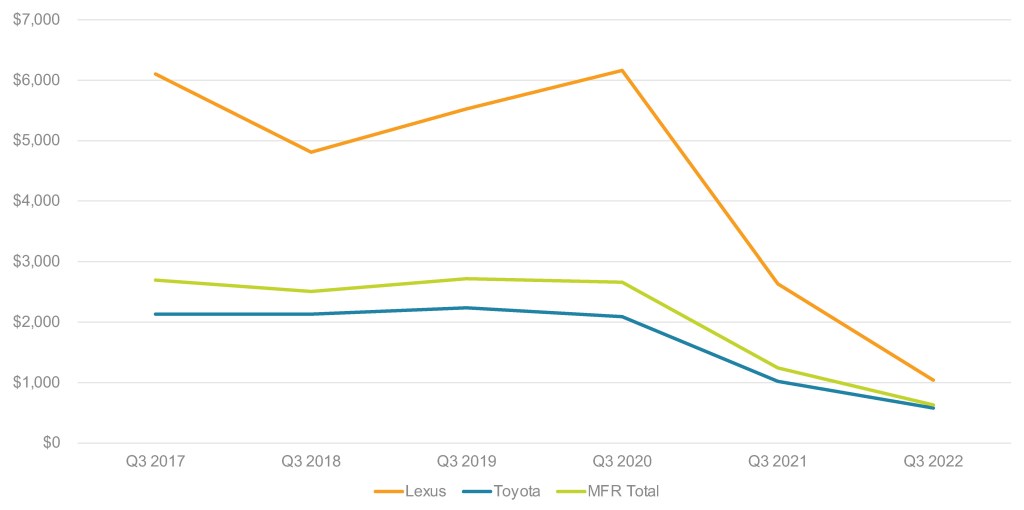
Toyota brand incentives were slashed by 43% to an average of $580 per vehicle, the first time in the quarter it fell below $1,000 per vehicle. Lexus incentives were reduced by 61% to an average of $1,041 per vehicle.
Overall Average Transaction Price Remains Above $40,000
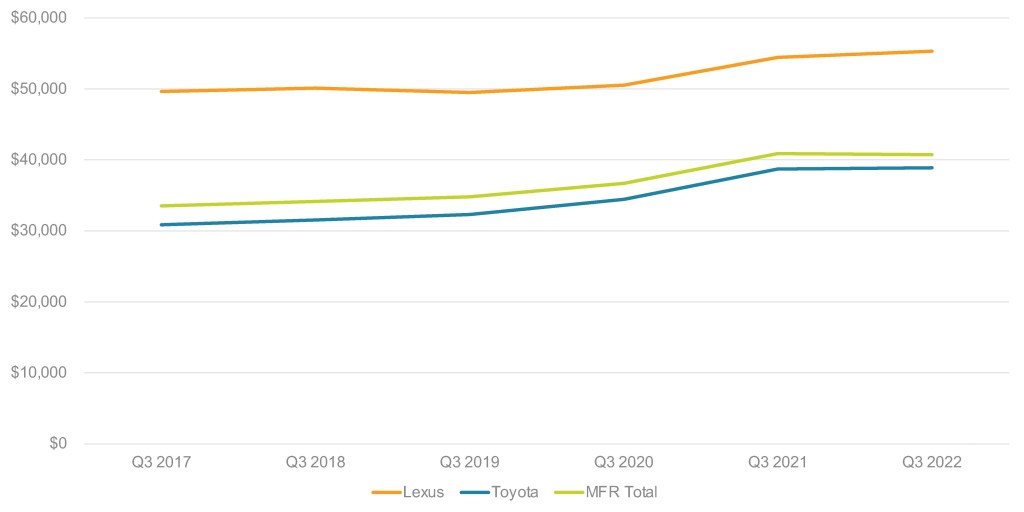
Toyota Motor Corp.’s overall average transaction price (ATP) was down 0.4% to $40,721. Popular models which have been recently updated or revised, such as the Tundra, saw ATP rise nearly 22% to $61,039; the fresh Sequoia ATPs rose 24% to $79,049. The Mirai was down 41% to $28,135. The rest of Toyota’s models showed a mixed bag of single-digit increases and decreases. All Lexus models saw incremental ATP increases except for the RC, which was down 2% to $55,566.
TOYOTA MOTOR CORP. U.S. AVERAGE TRANSACTION PRICE FOR Q2 FISCAL YEAR 2023
Rebecca Rydzewski is a research manager for economic and industry insights for Cox Automotive.