Data Point
Cox Automotive Analysis: Toyota Motor Corporation’s Quarterly U.S. Market Performance
Monday February 5, 2024
Article Highlights
- Toyota sales rose 15% to the second-highest level for the quarter.
- Toyota boosted incentives, but they remain low at an average of $1,083 per vehicle.
- Toyota Motor’s average transaction price climbed to $44,403.
Toyota Motor is expected to post a hefty increase in quarterly earnings and revenues when it reports financial results on Feb. 6, thanks to a rebound in production following the global computer chip shortage.
The October to December 2023 period is the Japanese automaker’s third quarter of its fiscal year 2024, which ends March 31. Analysts predict a 47% increase in net profit to more than $7.2 billion on a 19% gain in revenue.
In the U.S., Toyota enjoyed improved inventory, though supply remains well below the industry average. As a result, Toyota outperformed the U.S. auto industry, with sales up 15%, allowing it to gain a full percentage of market share. While Toyota boosted incentives in the quarter, they remain far lower than before the pandemic. Its average transaction price rose above $41,000 due to higher Lexus prices. Higher sales, low incentives and improved ATPs mean Toyota’s U.S. operations provided solidly to the automaker’s bottom line.
Here are some data points from Cox Automotive on Toyota’s quarterly market performance in the U.S., one of its most important markets.
Toyota’s U.S. Sales Gained on Improved Inventory
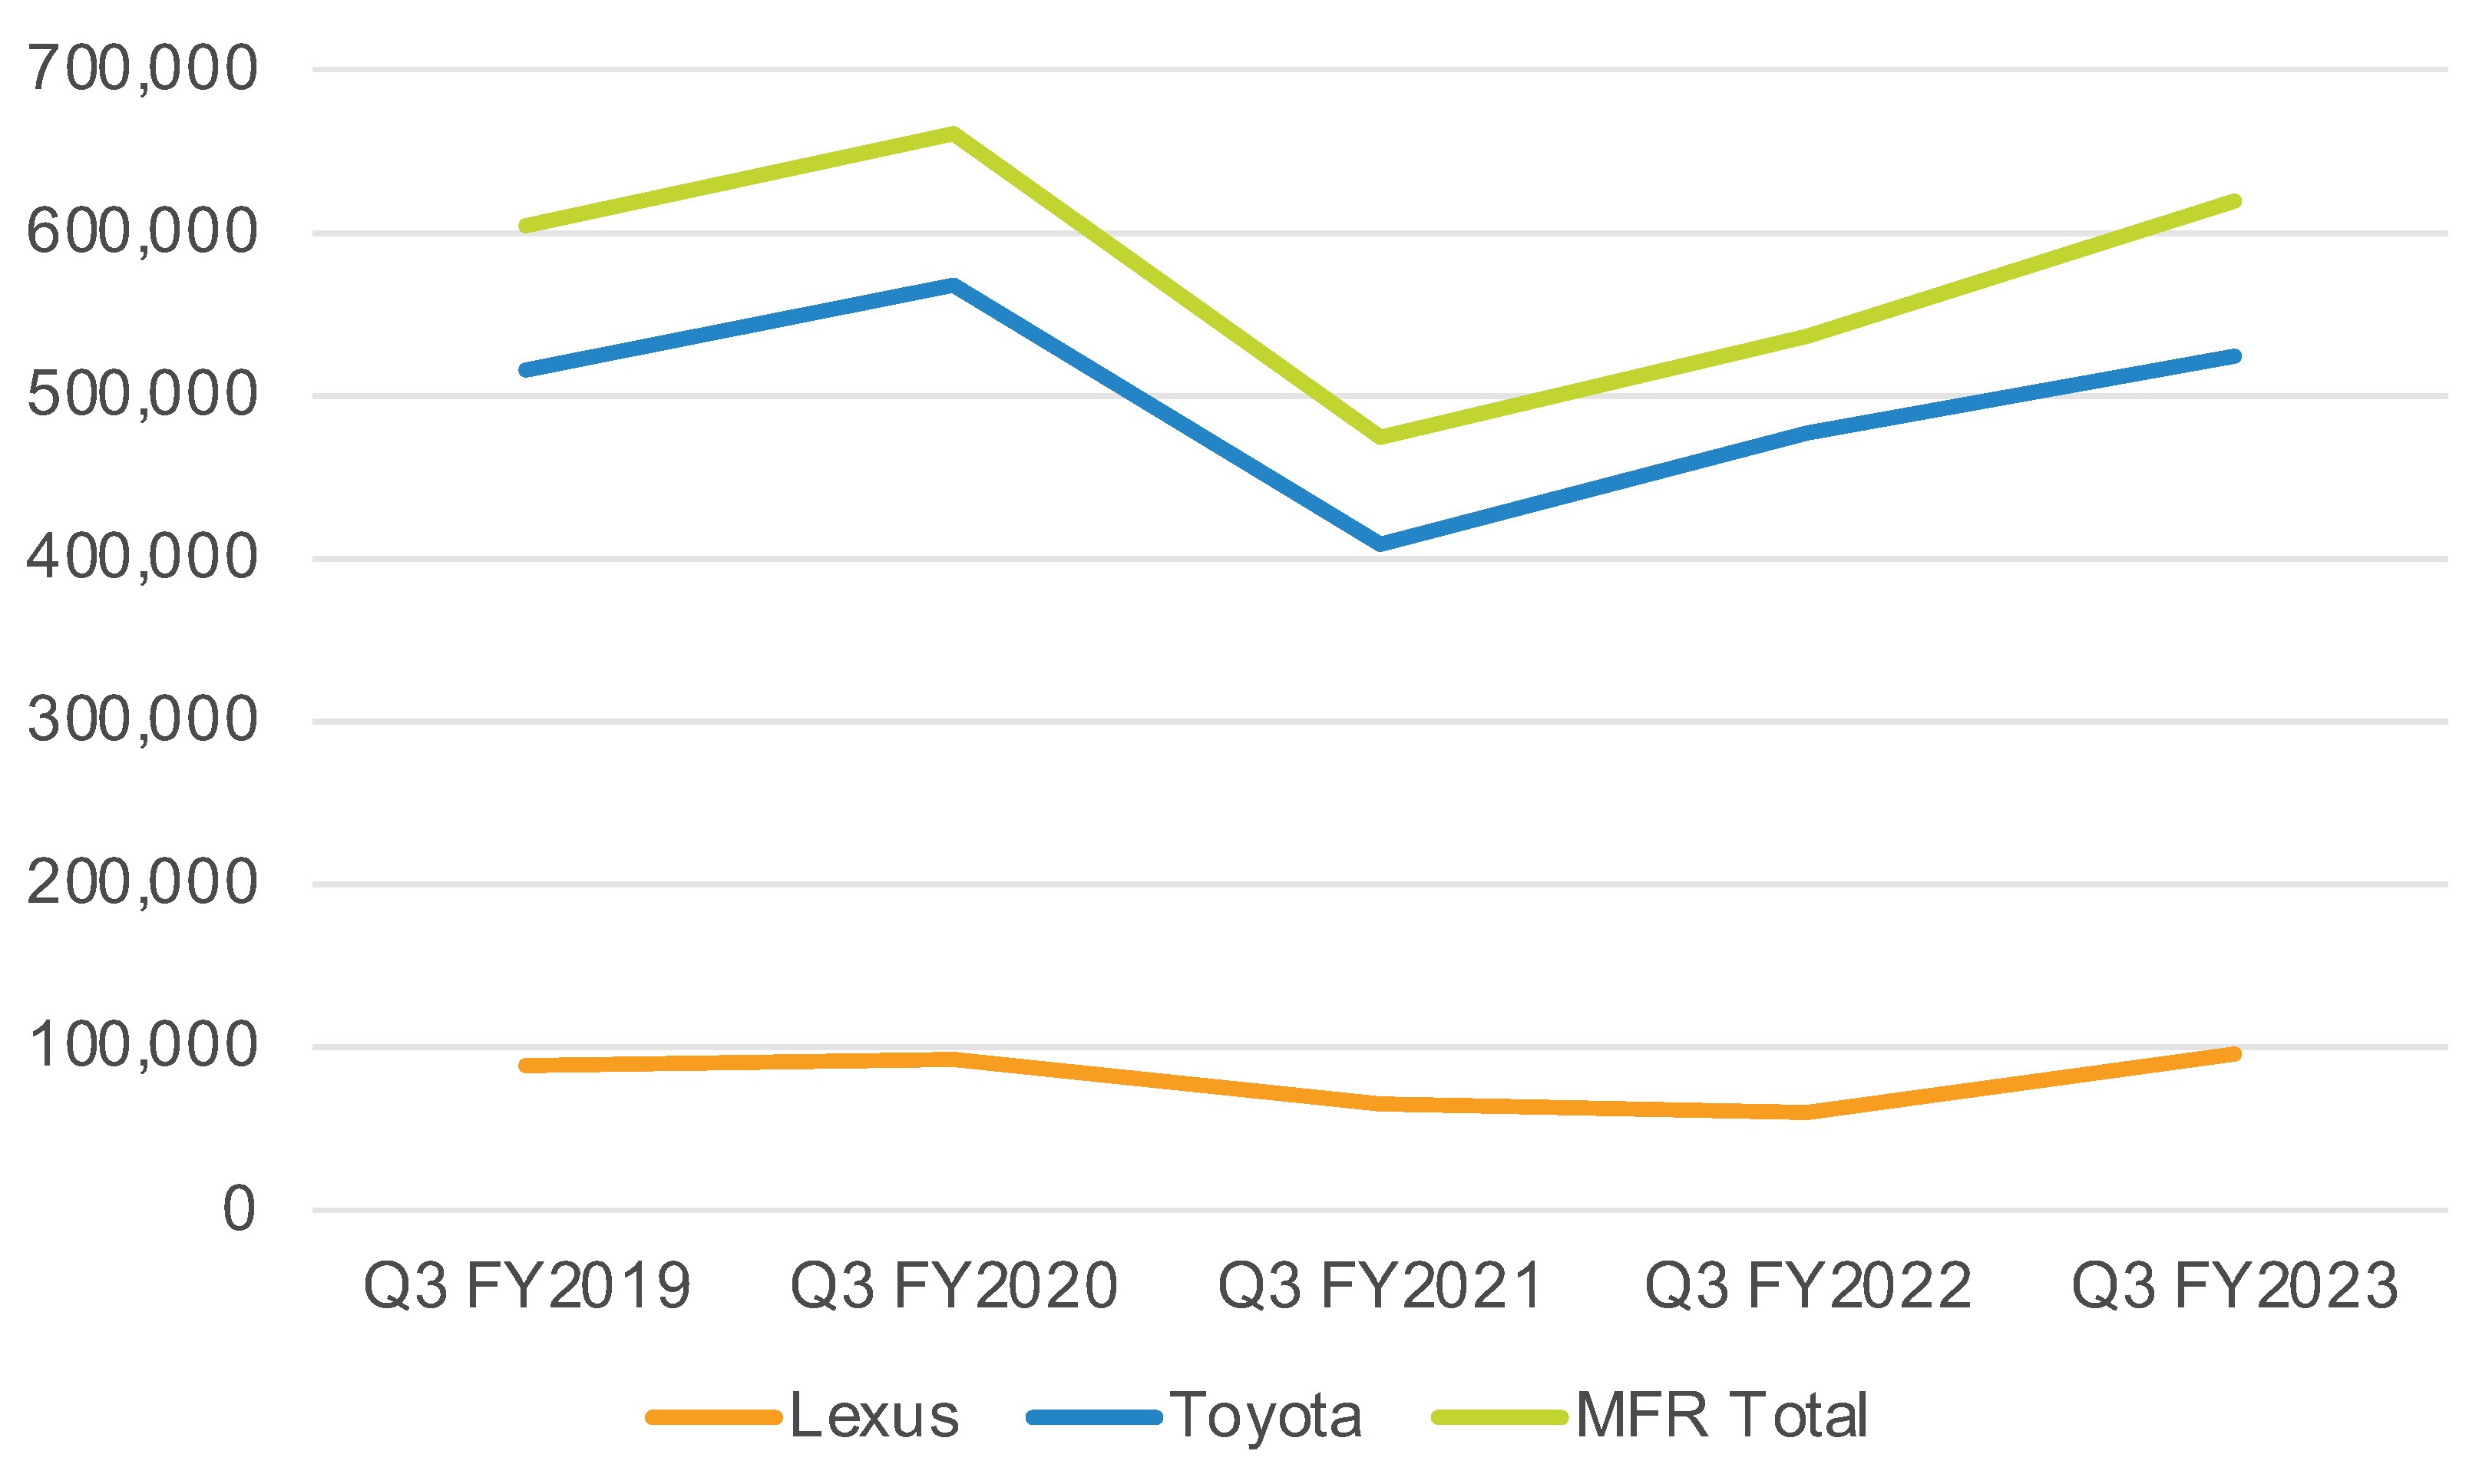
Toyota Motor’s U.S. sales totaled 619,661 vehicles, up 15% from the year-earlier quarter, according to Cox Automotive calculations. It was the automaker’s second-best sales volume for the quarter in at least five years. Only the final quarter of the calendar year 2020 was higher at more than 660,000 units.
TOYOTA MOTOR CORP. U.S. SALES FOR Q3 FISCAL YEAR 2024
Toyota Motor’s sales of electrified models, mostly hybrids, have been running at between 25% and 33% of its total sales. Globally, 36% of Toyota’s sales were of electrified models.
Toyota brand sales climbed 10% to 523,710 vehicles. Like the automaker in total, it was the brand’s second-best sales volume in the past five years for the quarter. Only the final quarter of 2020 was higher at nearly 568,000 units sold.
By Toyota brand model, sales were mixed. The volume-leading RAV4 reported a 37% hike in sales to 132,112 vehicles. Corolla, which Toyota says is the most requested model by dealers, was up 27% to 88,627 cars. Toyota’s other volume model, the Camry, had sales down 10% to 72,674 units. Sequoia sales rose 33%, hitting a record for the quarter. Sales of 4Runner were up by double digits, and Tundra sales edged 9% higher. Prius sales were up 3%. Sales of Toyota’s only EV, the low-volume BZ4x, soared by 189% to 2,843 units.
Tacoma truck sales were off 10%, as its inventories are among the lowest for popular-selling models in the U.S. Likewise, sales of the Sienna and Venza, both offered only as hybrids, were also down.
The new Grand Highlander kicked in sales of 23,660 units, but they came at the expense of Highlander sales, which only reached 31,365 and were down 46% compared to the same quarter last year.
Lexus sales soared by 60% to 95,941, the highest total for the quarter in the past five years. Lexus’ volume models posted double-digit increases.
Sales of the volume-leading Lexus RX jumped by 94% to 30,542 units, closer to sales levels achieved before the pandemic and the chip shortage. Lexus’ second-highest volume model, the NX, posted a 32% gain to 22,241. The GX had a 39% hike, and the ES gained 9%.
Toyota’s U.S. Market Share Rose
Toyota outperformed the overall market in the quarter. Industry sales were up 8%, while Toyota Motor’s sales were up 15%. That put Toyota’s overall market share at 15.88%, a full percentage point above the year-earlier quarter and the highest share for the quarter in at least five years.
Lexus accounted for most of the hike, rising by 0.8 percentage points to 2.46%.
The Toyota brand earned a 0.2 percentage point gain for a market share of 13.42%. Toyota brand only had a higher market share once in the past five years, when it hit 13.53% in the final quarter of the 2020 calendar year.
Toyota Bumped Up Incentives, But They Remain Low
Toyota bumped incentives to an average of $1,083 per vehicle, according to Cox Automotive calculations. That is slightly higher than the previous quarter and 64% higher than a year ago, but it remains well below pre-pandemic levels when Toyota spent between $2,500 to $2,700 per vehicle.
TOYOTA MOTOR CORP. U.S. INCENTIVE SPENDING FOR Q3 FISCAL YEAR 2024
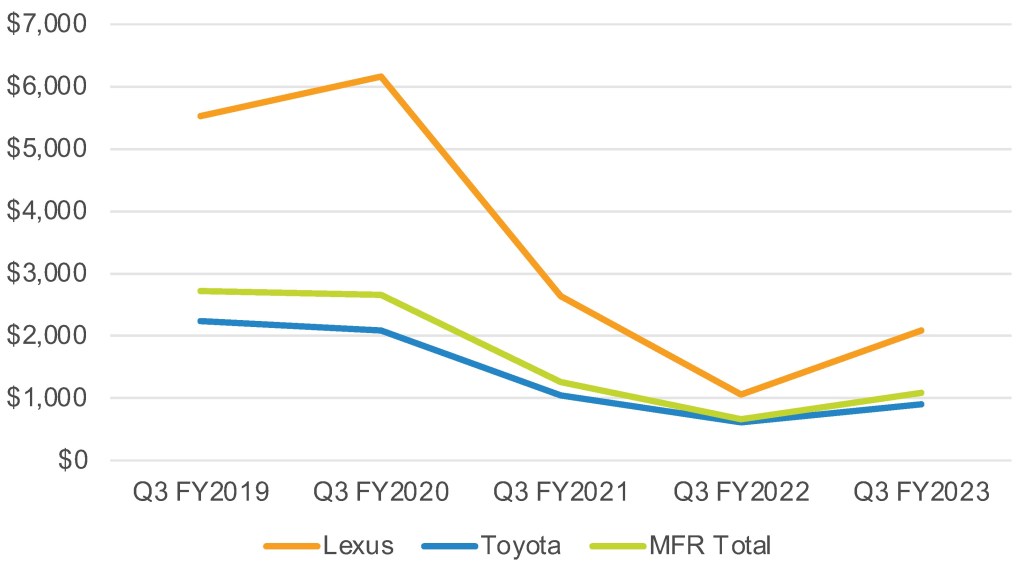
Lexus’ incentives nearly doubled. They were up 97% to an average of $2,084 per vehicle. Before the pandemic, Lexus typically spent between $4,800 and $6,200 per vehicle on average.
Toyota brand incentives rose 47% to an extremely low $899 per vehicle average for non-luxury brands. Before the pandemic, Toyota generally spent between $2,500 and $2,700 per vehicle.
Toyota Motor Average Transaction Price Climbed Above $44,000
Toyota Motor’s overall average transaction price (ATP) edged 12.8% higher to $44,403, according to Cox Automotive calculations.
TOYOTA MOTOR CORP. U.S. AVERAGE TRANSACTION PRICE FOR Q3 FISCAL YEAR 2024
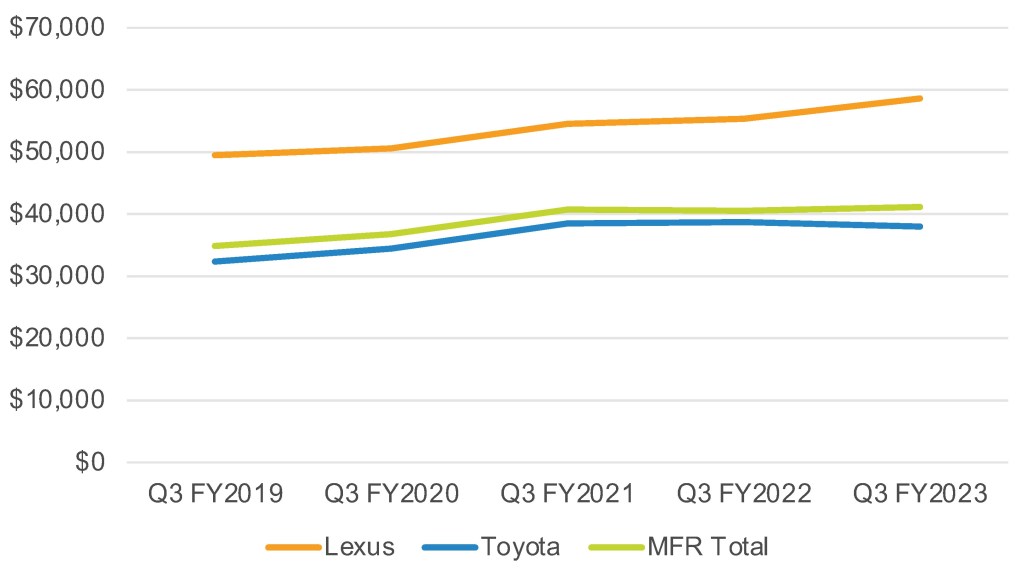
Toyota Motor’s ATP rise was mostly due to Lexus, which had a 6% increase to $58,641, a record high for the quarter and nearly $9,000 higher than in the equivalent 2018 quarter.
The ATP on the RX rose 7% to $61,791. The RC had an 8% rise to $59,391. Those were the highest percentage increases. The rest of the line was a mix of low single-digit increases and decreases. The LX and LC carry Lexus’ highest ATPs at over $100,000. The UX is Lexus’ least expensive model at $41,604.
The Toyota brand’s ATP increased 14.6% to $44,403 from a year ago and up from the previous quarter. In the final quarter of fiscal year 2022 and 2021, Toyota brand’s ATP was closer to $38,500.
Toyota brand’s ATP is affected by hefty sales of the Corolla, Toyota’s least expensive model at $29,875. The hybrid-only Sienna, Prius and Venza had healthy gains in ATP, as did the Highlander, which is available as a hybrid. With an ATP of $58,641, the new Grand Highlander contributed to the increase in Toyota brand’s ATP. Other Toyota models had single-digit increases in ATPs.