
The number of incentive programs available to consumers in Q3 increased significantly from Q2, according to data from the Cox Automotive Rates & Incentives team. Incentive program volume – literally a count of the number of different incentive programs in the market each month, but not the value of the programs – hit record levels in 2019 as automakers worked hard to push the auto industry volume past 17 million units for the 5th consecutive year.
Year-to-date incentive program volume is down in 2020, as Q2 saw program volume track well below 2019 levels. With few shoppers and plenty of uncertainty in the market, automakers chose to play it simple in Q2: Nearly every maker offered some form of 0% financing and made few changes to their programs. Total program volume in Q2 was down 23.5% from year-earlier levels and well below the five-year average.
In Q3, the volume of incentive programs increased notably. This was particularly true for the Detroit-based auto brands, as they typically offer a larger variety of incentive programs and concentrate on unique regional programs as well. Ford, specifically, is known to reshuffle their incentive programs throughout the month, pushing the total number of unique programs higher.
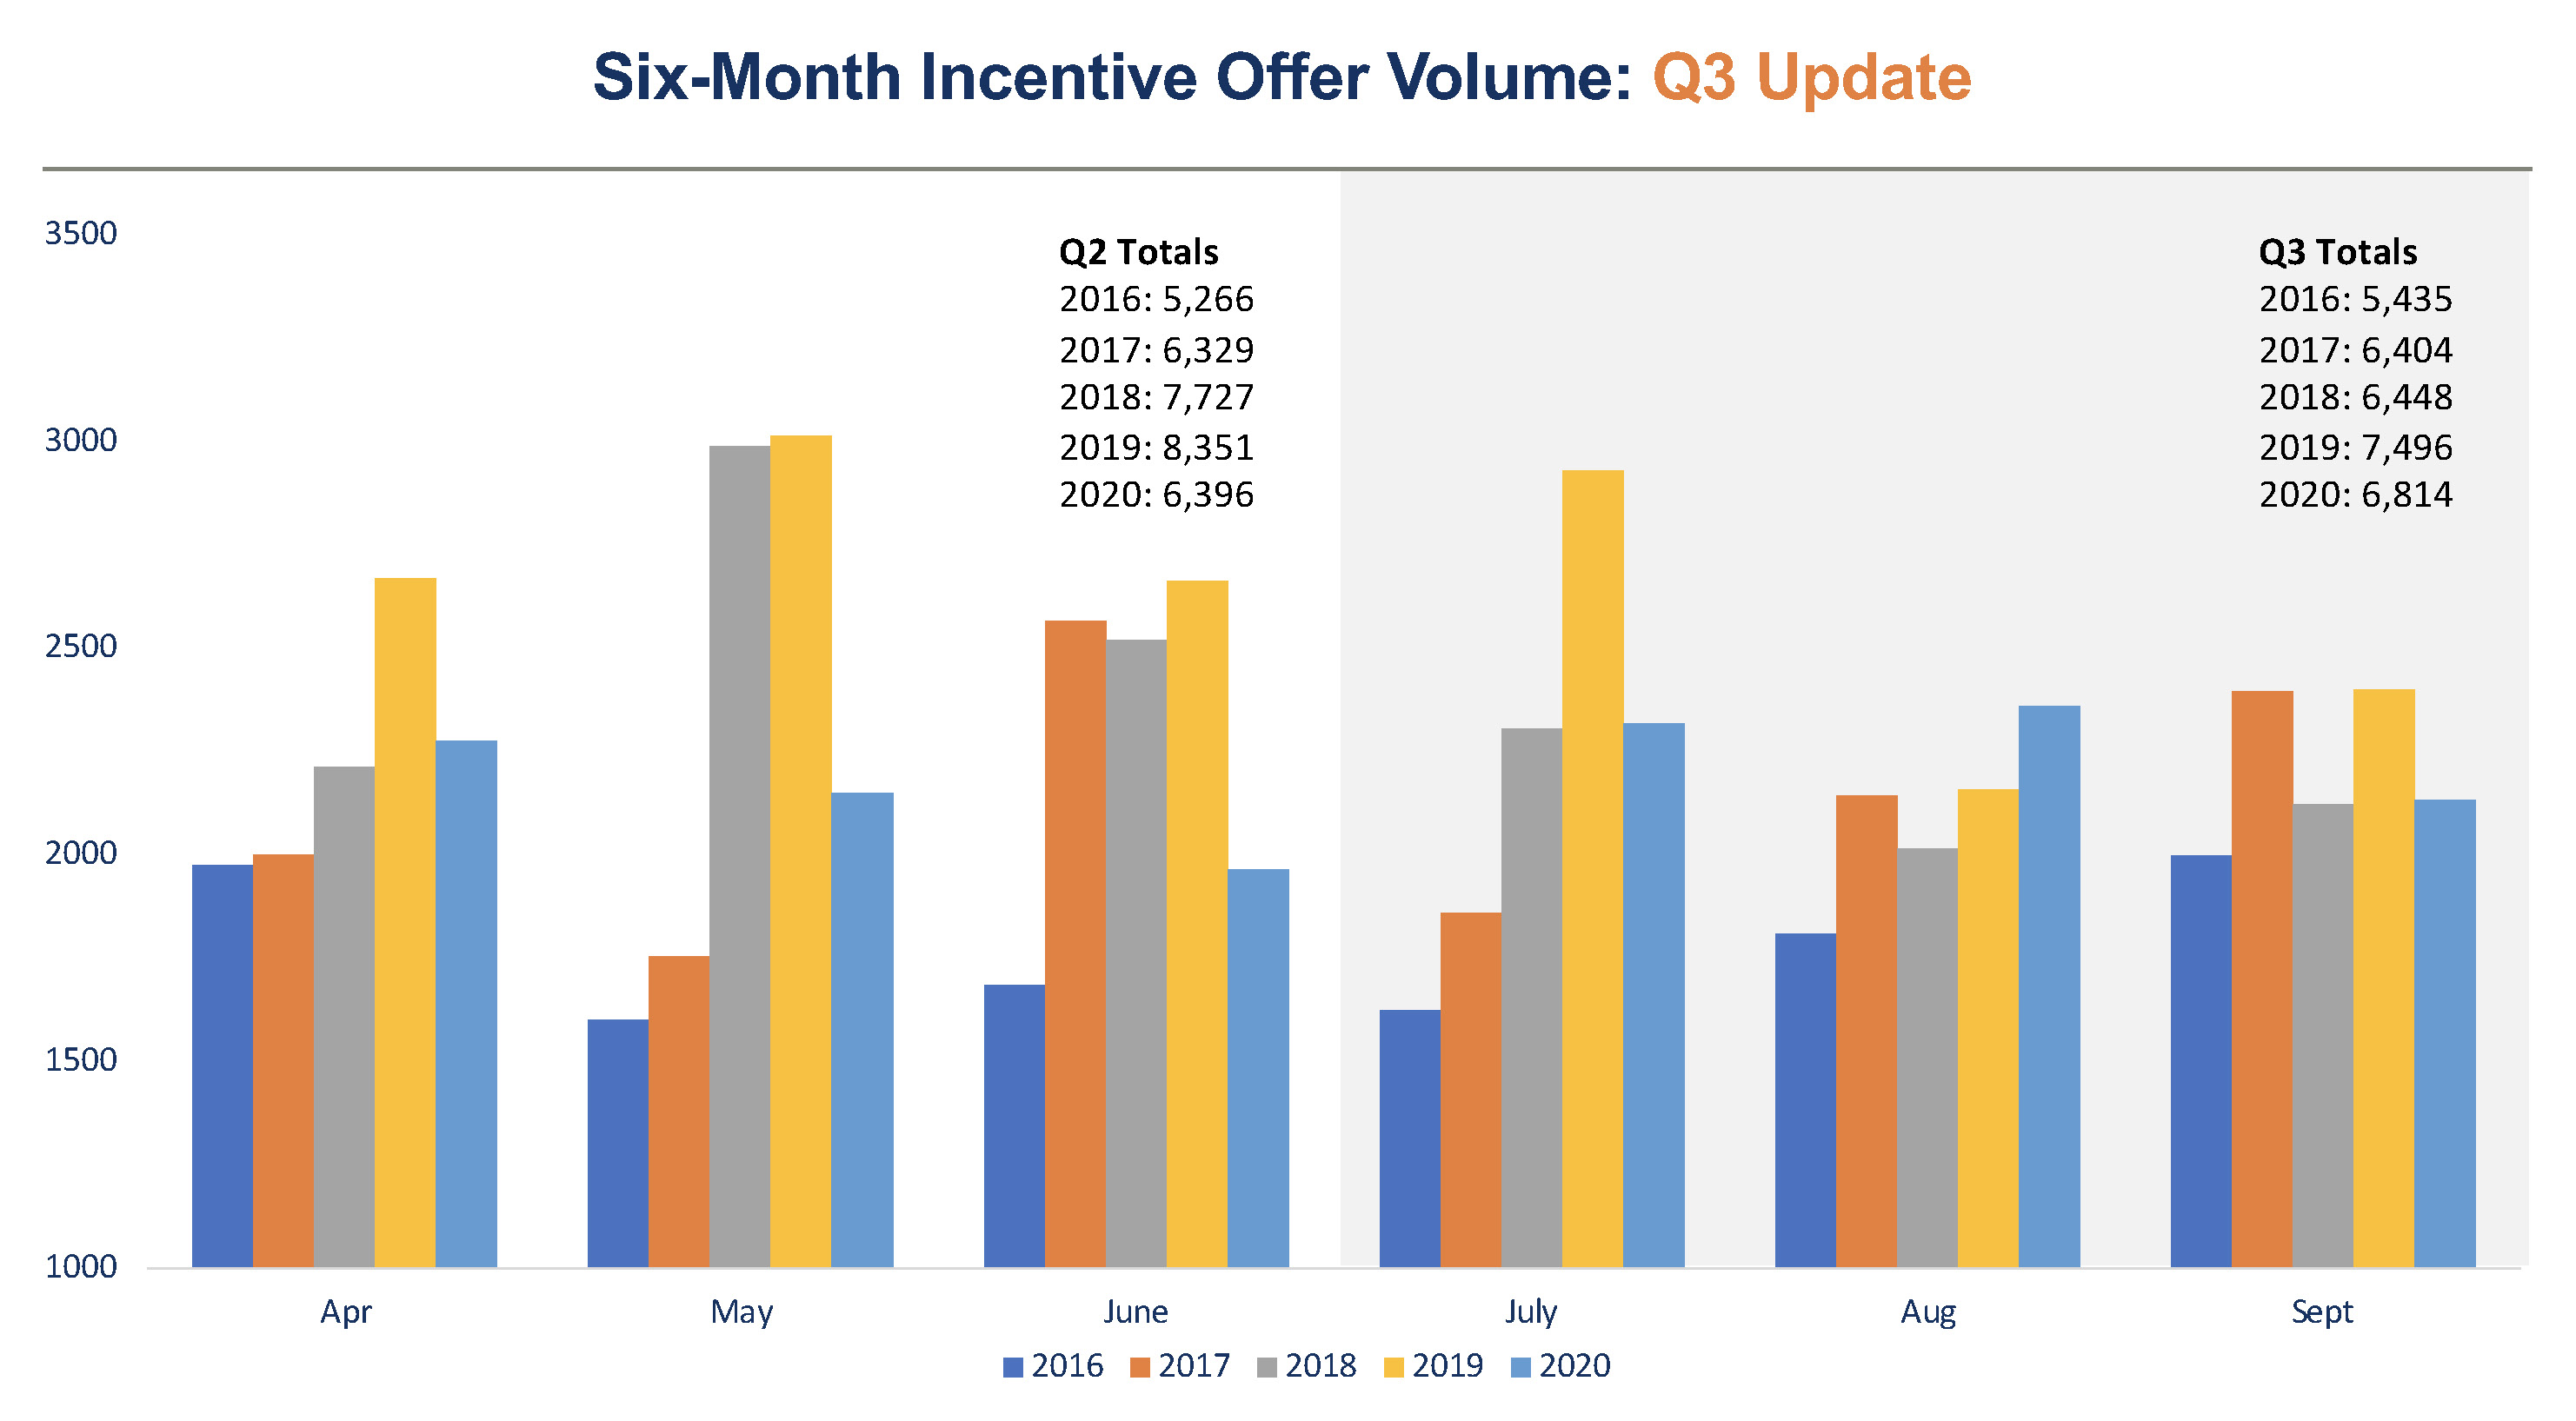
High program volume is an indication that automakers are putting more deals into the market, in hopes of stimulating higher sales – or stopping sales from dropping. In Q3, incentive program volume was down only 9% from year-earlier levels. Program volume in Q3 2020 was higher than the same timeframe in 2016, 2017 and 2018. The incentive departments are definitely getting back to normal.
An analysis by Cox Automotive also shows overall incentive spending as a percent of average transaction price is also increasing, although only modestly. Yes, there were more, richer deals being made available to vehicle buyers in Q3, but with inventory levels down, program volume and incentive spend is unlikely to go through the roof. It’s still a seller’s market and will be through Q4.
The Cox Automotive Rates & Incentives (CAR&I) team has developed a methodology for measuring the accuracy of data used to calculate pricing and payment information presented through dealer service provider tools (e.g., dealer websites, inventory management, digital retailing & advertising, desking, equity, etc.). Approximately 17,500 individual dealerships – rooftops, in automotive parlance – in the U.S. rely on CAR&I incentive data for powering 5 different software applications through Cox Automotive native software/sites and our many industry partners. In all, an estimated 90,000 applications are relying on CAR&I data in a given month, providing valuable information to 40 million shoppers.


