Data Point
Wholesale Prices Start Year Strong
Friday February 5, 2021
Article Highlights
- Wholesale used vehicle prices (on a mix-, mileage-, and seasonally adjusted basis) decreased 0.59% month over month in December.
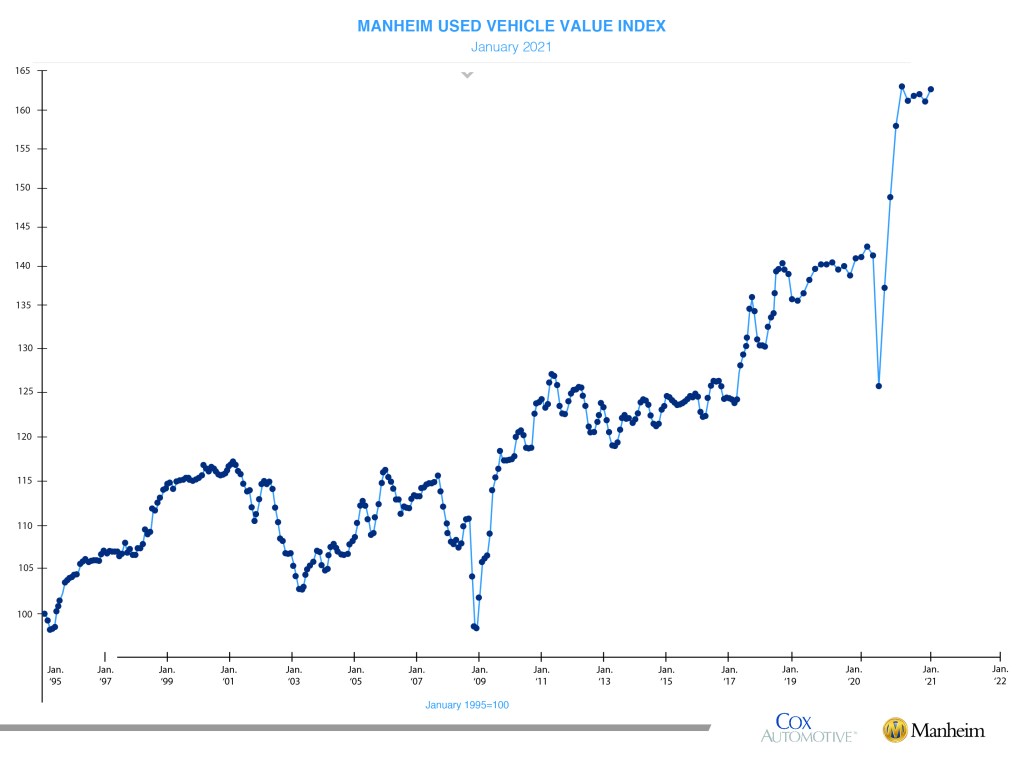
- This brought the Manheim Used Vehicle Value Index to 161.1, a 14.2% increase from a year ago.
- Manheim Market Report (MMR) prices declined each week over the four full weeks of December, resulting in a 2.2% cumulative decline on the Three-Year-Old Index.
Wholesale used vehicle prices (on a mix-, mileage-, and seasonally adjusted basis) increased 1.23% month over month in January. This brought the Manheim Used Vehicle Value Index to 163.0, a 15.1% increase from a year ago.
Manheim Market Report (MMR) prices strengthened as the month progressed. The Three-Year-Old MMR Index, which represents the largest model year cohort at auction, increased 0.4% last week, bringing prices even with the start of the year. The increase last week was the strongest increase for that week of any year back to 2014. Over the month of January, MMR Retention, which is the average difference in price relative to current MMR, averaged 100.4%. The sales conversion rate increased for most of the month.
On a year-over-year basis, all major market segments saw seasonally adjusted price increases in January. Luxury cars and pickup trucks outperformed the overall market, while most other major segments underperformed the overall market.

For 26 years, the MUVVI has been the definitive source on the state of the used vehicle market. Based on millions of individual valuations each year, it is the automotive industry’s only measure of used vehicle values that is seasonally adjusted and accounts for changes in mix and mileage of vehicles sold. The monthly data are derived from vehicles sold at Manheim’s U.S. locations and on its digital properties. Stock market analysts and media use the MUVVI as an indicator of the health of the economy and automotive industry.
The complete suite of monthly MUVVI data is released the fifth business day of the month. The next quarterly call will be held on Wednesday, April 7, 2021. If you have any questions regarding the Index, please contact the Cox Automotive Industry Insights team at Manheim.Data@coxautoinc.com.
